This website uses Cookies. Click Accept to agree to our website's cookie use as described in our Privacy Policy. Click Preferences to customize your cookie settings.
Turn on suggestions
Auto-suggest helps you quickly narrow down your search results by suggesting possible matches as you type.
- Dynatrace Community
- Dynatrace
- Ask
- Open Q&A
- what could be the reason for reduction of JVM thread count for live traffic.
Options
- Subscribe to RSS Feed
- Mark Topic as New
- Mark Topic as Read
- Pin this Topic for Current User
- Printer Friendly Page
what could be the reason for reduction of JVM thread count for live traffic.
Options
- Mark as New
- Subscribe to RSS Feed
- Permalink
17 Apr 2020 02:40 PM
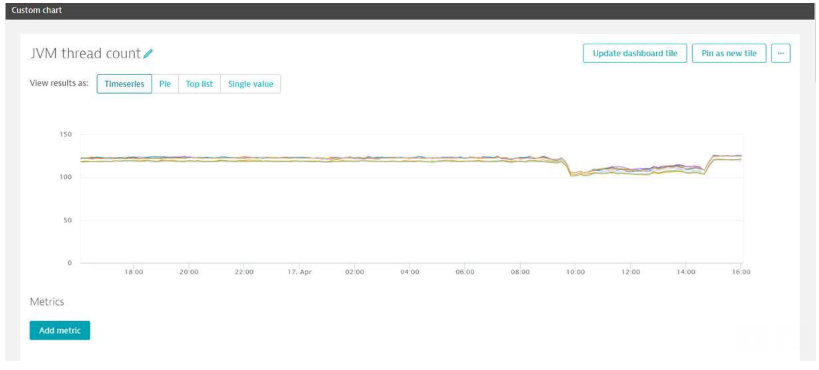
let say there are around 100 users/sec traffic available in prod and we were running a test in the same prod env with 1000 user/sec. when we monitor the JVM hazelcast thread counts for all hosts, we could see reduction in the count during our test window. how is this possible? Please find the screenshot attached. the dip in the thread count is the testing time, where more traffic went to the application.
Labels:
- Labels:
-
java
2 REPLIES 2
Options
- Mark as New
- Subscribe to RSS Feed
- Permalink
17 Apr 2020 05:41 PM
The JVMs might be reacting to other factors, namely memory. Have you got a lot of GC going on?
Antonio Sousa
Options
- Mark as New
- Subscribe to RSS Feed
- Permalink
24 Apr 2020 06:37 PM
the GC was pretty normal during the duration
