- Dynatrace Community
- Ask
- Real User Monitoring
- Not geting data in Elasticsearch using "User Session Export"
- Subscribe to RSS Feed
- Mark Topic as New
- Mark Topic as Read
- Pin this Topic for Current User
- Printer Friendly Page
- Mark as New
- Subscribe to RSS Feed
- Permalink
27 Sep 2018
10:44 AM
- last edited on
27 Apr 2021
01:39 PM
by
![]() MaciejNeumann
MaciejNeumann
Hi,
I'm trying to post data to my Elasticsearch database which is publicly accessible.
I'm following https://www.dynatrace.com/news/blog/export-dynatr... link and I've done the configuration accordingly.
But my Elasticsearch(ES) database haven't received any data.
Now the question is do I've to manually push the data (which I don't think so but if yes) then how to do that or it'll be done automatically if yes then when Dynatrace sends data to ES.
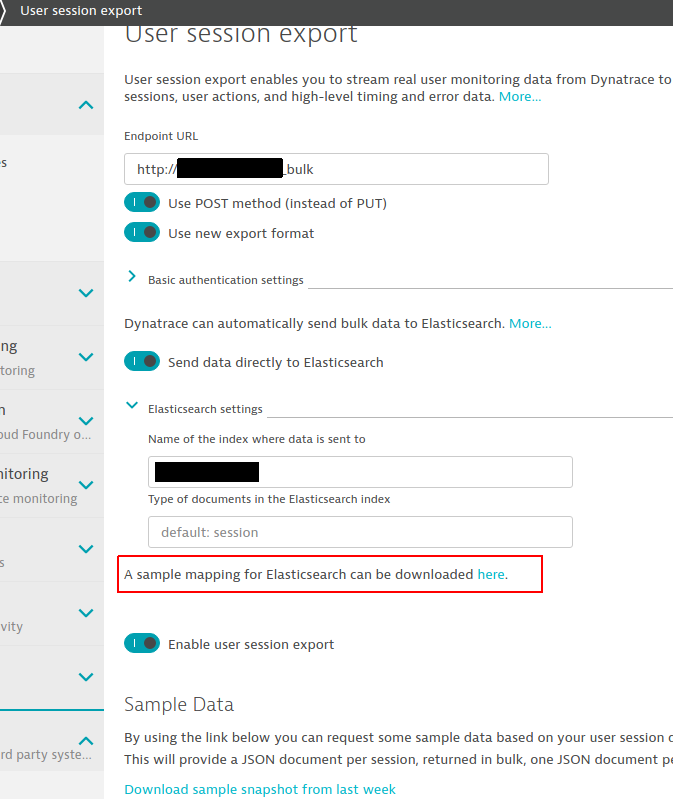
I've uploaded screenshot of my User session export configuration below:

Please suggest me how can I get data in ES or is there anything need to be correct in my config.
Thanks in Advance.
Solved! Go to Solution.
- Labels:
-
databases
-
user sessions
- Mark as New
- Subscribe to RSS Feed
- Permalink
28 Sep 2018 07:55 AM
If exporting fails for any reason, you should see a yellow warning bar in the Web-UI giving some more details.
Do you see more information there?
- Mark as New
- Subscribe to RSS Feed
- Permalink
28 Sep 2018 10:50 AM
Hi Dominik,
In User session export config I haven't set any basic authentication. My Elasticsearch is publicly accessible and I'm able to access it from out side of my local network.
Do I still need to set Basic authentication for User session export?
Thanks.
- Mark as New
- Subscribe to RSS Feed
- Permalink
28 Sep 2018 08:01 AM
Hi Dominik,
No I don't see any warning bar in the Web-UI.
- Mark as New
- Subscribe to RSS Feed
- Permalink
28 Sep 2018 05:50 PM
Hi Arpan,
I couple of months back I was having the same issue. Through trial and error, I notice that you need to use Elasticsearch version 5.* (I think that the reason is that version 6.* doesn't support multi-mapping type in the same index).
Also, I'm attaching the mapping that I used. Is important to create the index with this mapping before exporting the data from Dynatrace. Otherwise, Elasticsearch will assign the wrong type to some values.
default-mapping-for-dynarace.txt
Regards
Alonso
- Mark as New
- Subscribe to RSS Feed
- Permalink
01 Oct 2018 07:53 AM
Hi Alonso,
Thanks for suggestion.
I've downgrade ES to 5.6.
Arpan
- Mark as New
- Subscribe to RSS Feed
- Permalink
02 Oct 2018 05:54 PM
Just an update, ES 6.4.1 is also working correctly with User Session export
- Mark as New
- Subscribe to RSS Feed
- Permalink
22 Nov 2018 09:54 AM
Is it working with 6.4.3 too? I'm using that version, but no data has been sent to ES
- Mark as New
- Subscribe to RSS Feed
- Permalink
01 Oct 2018 08:14 AM
Hi,
I've downgraded ES to 5.6 and done mapping as well.
I've changed the name of index from testDemo to testdemo (because index name should not be in caps).
But unfortunately not received data to my ES.
Are there any log of user session export to check of issue.
What else can be done to resolve the issue please suggest.
Thanks
Arpan
- Mark as New
- Subscribe to RSS Feed
- Permalink
01 Oct 2018 06:56 PM
Hi Arpan,
I just recreated everything, and ES 5.6 is working fine in my demo environment.
I will suggest validating the following things:
- Validate that the firewall isn't blocking the traffic
* - If you are using ES with X Pack, make sure that the user has the correct permissions.
* - Run "GET /_cat/indices?v" to validate if Dynatrace isn't sending the data to the default setting.
Alonso
- Mark as New
- Subscribe to RSS Feed
- Permalink
08 Oct 2018 11:21 AM
Hi,
This is my recollection about setting this up and getting it to work:
- I used Elastic (and kibana) 6.2.4
- Test the url <public IP>:9200 that you set in dynatrace, making sure you are outside where the elastic server is located (let's say from your house or elsewhere). In my case, the elastic server was in the office and a coworker had to configure the firewall to route the 9200 port to the this server.
- In your elastic server, create the index beforehand, with the correct mapping. You have to download the sample mapping file from the dynatrace integration settings.

If you don’t do this, the date fields will be interpreted as numbers. You don’t want this.
- Set the dynatrace integration in your environment. I used the same settings you showed in the screenshot
- Use an application, like the demo Easytravel, to generate visits
- Last step: check elastic log file. In ubuntu the log file is located at /var/log/elasticsearch/elasticsearch-yyyy-mm-dd.log
Hope this helps.
Kind regards,
Antonio V.
- Mark as New
- Subscribe to RSS Feed
- Permalink
01 Apr 2019 01:08 PM
Hi,
I am getting these issues while sending the data to the elastic node.
Exporting user session data to the configured custom REST endpoint https://zsearch-qa.zurichna.com:19200 failed: Status: 405: Method Not Allowed - {"error":"Incorrect HTTP method for uri [/] and method [POST], allowed: [HEAD, DELETE, GET]","status":405} Code: 400 - Message: Bad Request
checked with support still, they are looking into it.
Please refer the attached snapshot shows the integration details.
elasticserachdynatrace01.pngelasticserachdynatrace02.png
Featured Posts
