- Dynatrace Community
- Ask
- Alerting
- How to see ASP.NET page lifecycle details under the PurePath Code Level area?
- Subscribe to RSS Feed
- Mark Topic as New
- Mark Topic as Read
- Pin this Topic for Current User
- Printer Friendly Page
- Mark as New
- Subscribe to RSS Feed
- Permalink
03 Oct 2020
11:59 PM
- last edited on
14 May 2021
01:38 PM
by
![]() MaciejNeumann
MaciejNeumann
We have recently upgraded from AppMon to the new Dynatrace. We are desperately looking for the help with below items.
1) How do we see ASP.NET page lifecycle details under the PurePath Code Level area?
2) How do we trigger an alert based on the specific exception from Method?
Solved! Go to Solution.
- Mark as New
- Subscribe to RSS Feed
- Permalink
15 Oct 2020 02:31 PM
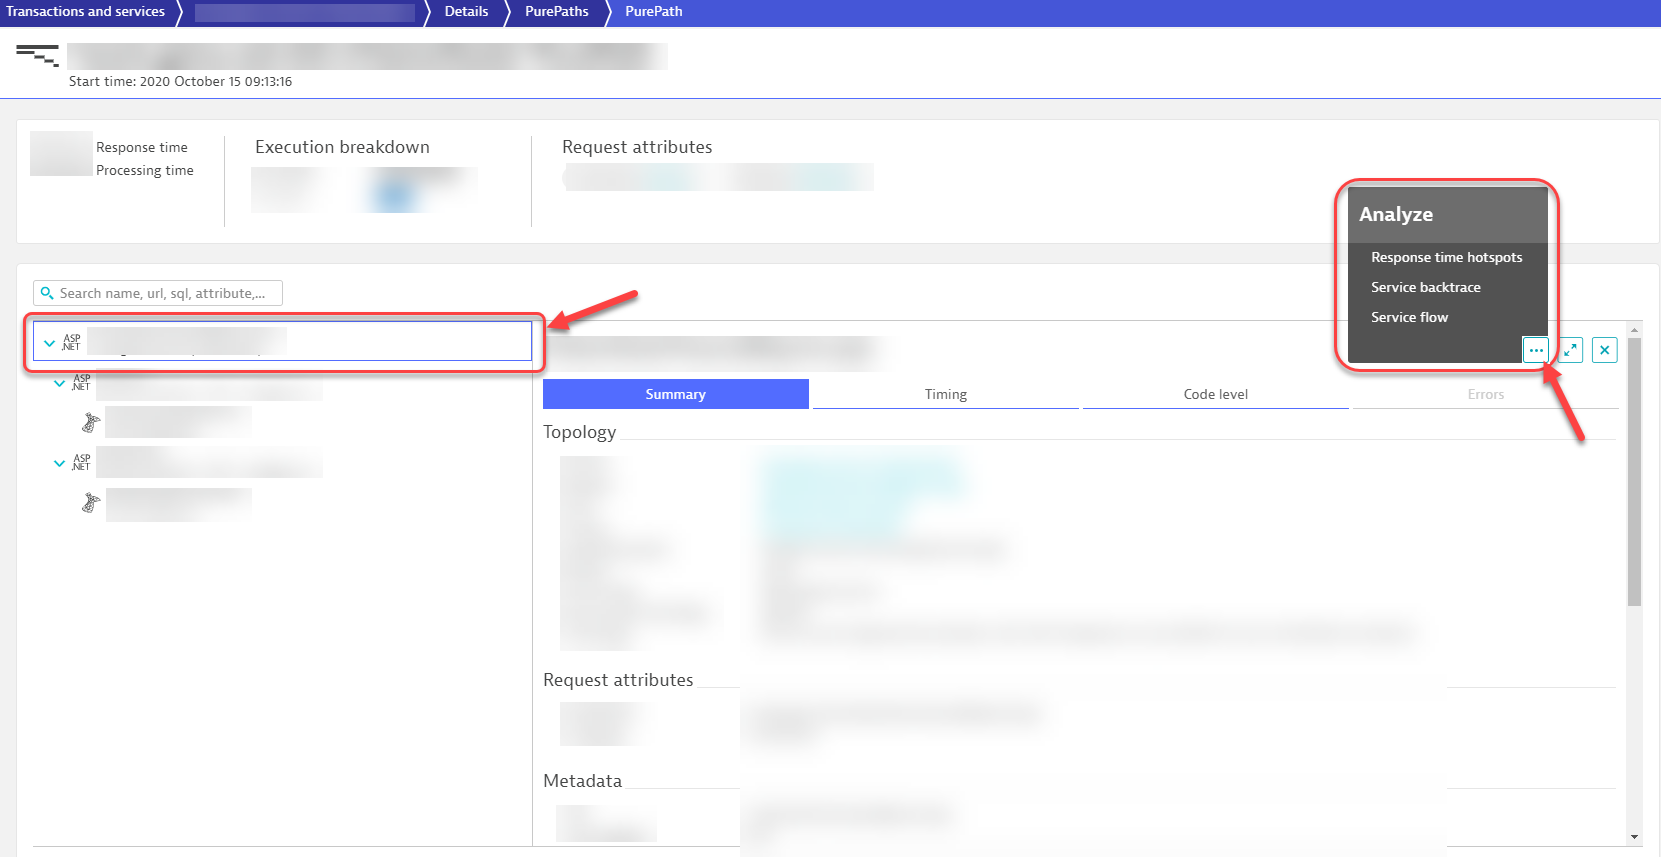
Hey @Gaurav T. 1.) this can be done from the pure path level by selecting the entity of the transaction, in the left hand side, and then navigating over to the "..." where Dynatrace will provide you with more options to see the backtrace, the service flow, hotspots and more.

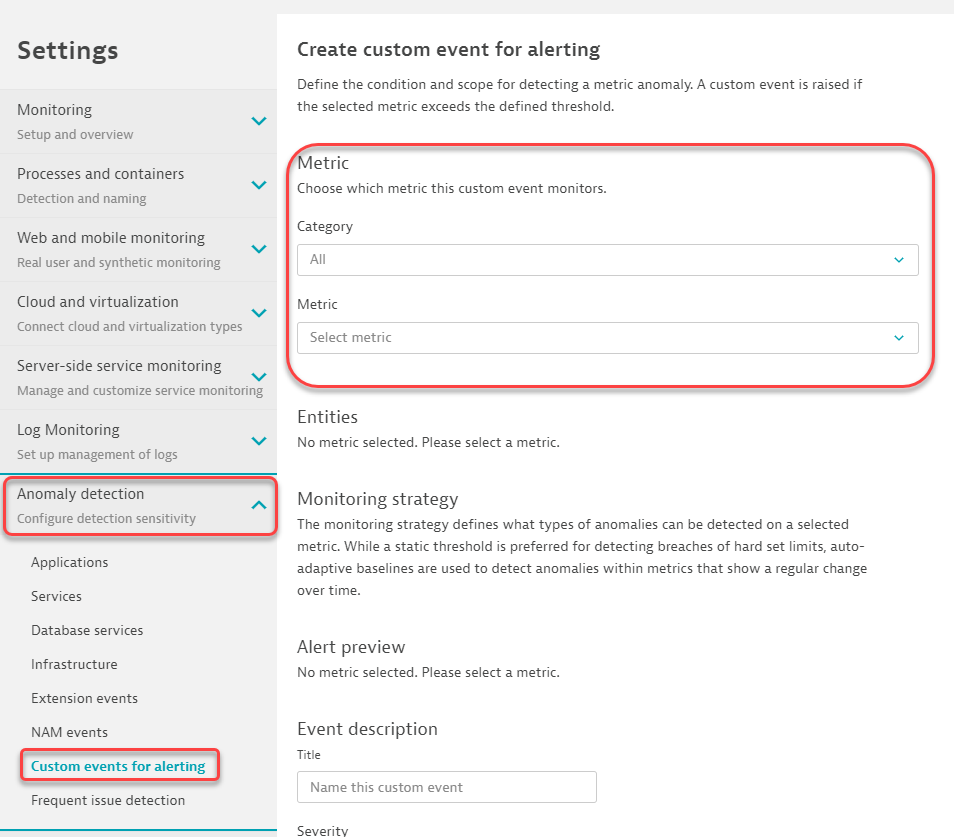
2.) You can create alerts as needed and the possibilities are endless. From a free level, if you navigate to Settings>Anomaly Detection>Custom Events for Alerting>Create Custom Event for Alerting.

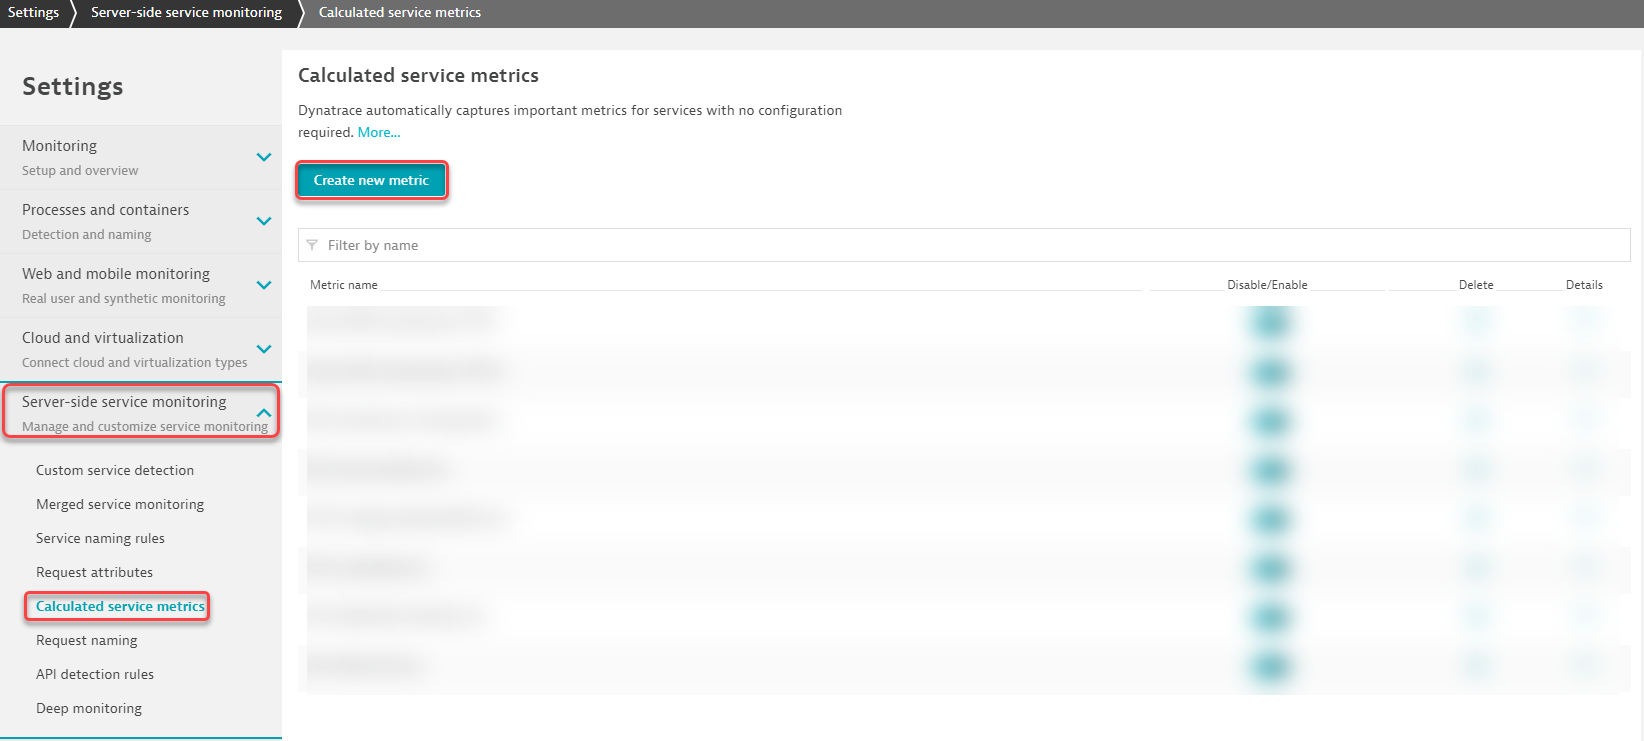
For a more customized and granular level, you can create a Calculated Service Metric (this will use Custom Metric Licenses) To do this, go to Settings>Server-Side Service Monitoring>Calculated Service metrics>Create New Metric.

Featured Posts
