This website uses Cookies. Click Accept to agree to our website's cookie use as described in our Privacy Policy. Click Preferences to customize your cookie settings.
Dashboarding
Dynatrace dashboards, notebooks, and data explorer explained.
Turn on suggestions
Auto-suggest helps you quickly narrow down your search results by suggesting possible matches as you type.
- Community Home
- Platform
- Dashboarding
- Memory consumption graph scaled to specific process
Options
- Subscribe to RSS Feed
- Mark Topic as New
- Mark Topic as Read
- Pin this Topic for Current User
- Printer Friendly Page
Options
- Mark as New
- Subscribe to RSS Feed
- Permalink
01 Oct 2020
04:43 PM
- last edited on
20 Oct 2022
10:46 AM
by
![]() MaciejNeumann
MaciejNeumann
When analyzing Processes memory consumption on a VM host, the graph's Y axis is scaled to the VM's total memory - for instance, 0B to 20GB. However, I want to analyze the memory consumption growth of a specific process, which usually consumes only less than 1GB. Dynatrace currently doesn't offer a way of scaling the graph to a specific process scale (0B to 1GB, for instance). This makes it very hard to check for memory leaks of specific processes.
Solved! Go to Solution.
Labels:
- Labels:
-
data explorer
Reply
2 REPLIES 2
Options
- Mark as New
- Subscribe to RSS Feed
- Permalink
01 Oct 2020 07:19 PM
You can drill down to the individual process level and that might help you review the data for a memory leak. You could also create a custom chart that includes host memory usage and process memory usage as well and narrow down to the processes you desire.
-Chad
Options
- Mark as New
- Subscribe to RSS Feed
- Permalink
01 Oct 2020 10:48 PM
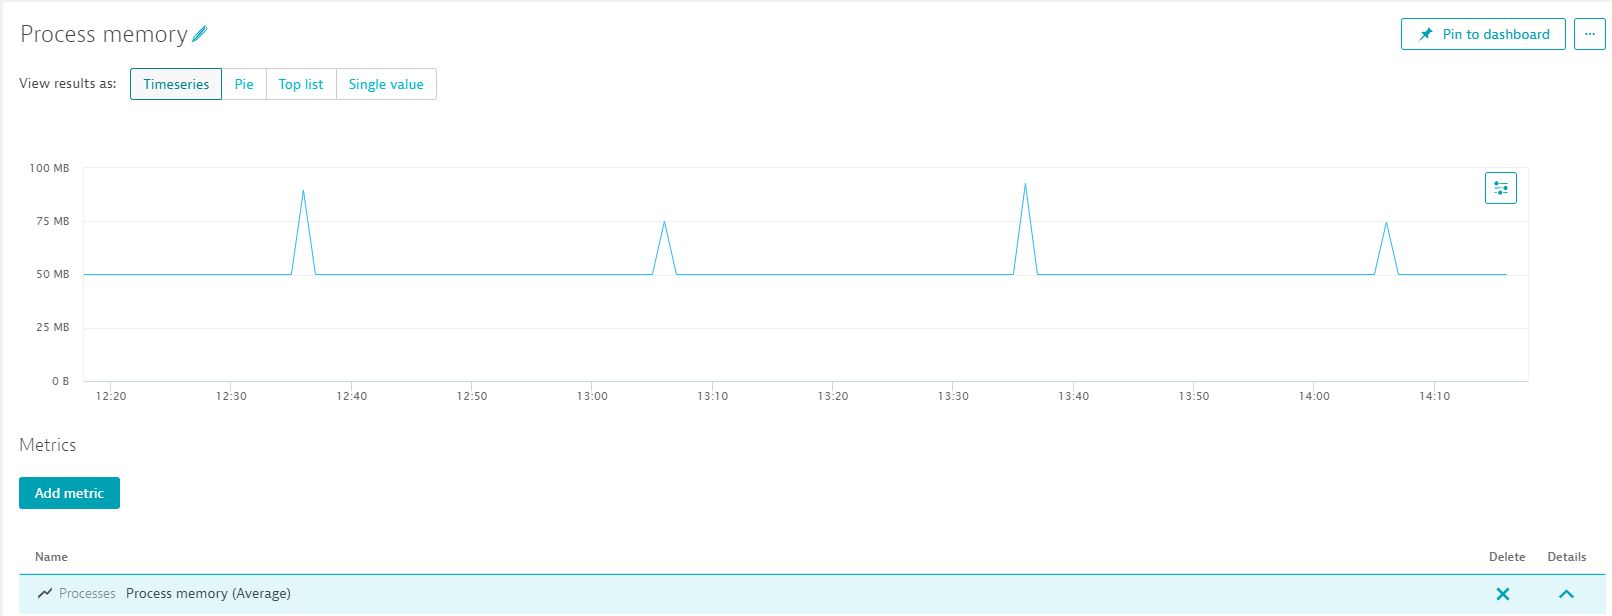
You can do it in Custom Graphs. Use Process Memory, that should be what you are looking for.
Antonio Sousa
Featured Posts
