This website uses Cookies. Click Accept to agree to our website's cookie use as described in our Privacy Policy. Click Preferences to customize your cookie settings.
Dashboarding
Dynatrace dashboards, notebooks, and data explorer explained.
Turn on suggestions
Auto-suggest helps you quickly narrow down your search results by suggesting possible matches as you type.
- Community Home
- Platform
- Dashboarding
- Network Interface Connectivity Representation
Options
- Subscribe to RSS Feed
- Mark Topic as New
- Mark Topic as Read
- Pin this Topic for Current User
- Printer Friendly Page
Options
- Mark as New
- Subscribe to RSS Feed
- Permalink
29 Mar 2020
03:37 PM
- last edited on
06 May 2021
02:38 PM
by
![]() MaciejNeumann
MaciejNeumann
Dear All,
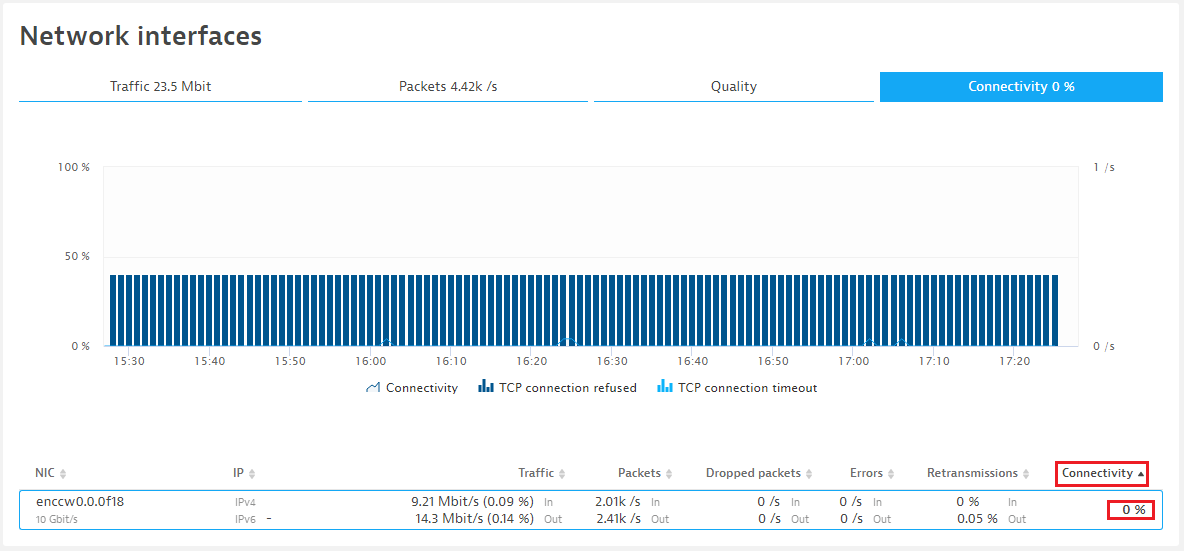
Why the connectivity representing 0% while you can see a lot of traffic on the interface?
Regards,
Babar
Solved! Go to Solution.
Labels:
- Labels:
-
network monitoring
10 REPLIES 10
Options
- Mark as New
- Subscribe to RSS Feed
- Permalink
29 Mar 2020 03:50 PM
Hi @Babar Q.
Its look like all your connections are being refused.
Check also the Quality tab.
Yos
dynatrace certificated professional - dynatrace master partner - Matrix Soft Ware Division - Israel
Options
- Mark as New
- Subscribe to RSS Feed
- Permalink
29 Mar 2020 03:53 PM
Hello @Yos N.
From where to where connections refused, because there is no issue with the monitoring?
Regards,
Babar
Options
- Mark as New
- Subscribe to RSS Feed
- Permalink
29 Mar 2020 04:00 PM
Go to connectivity from process perspective of this host
dynatrace certificated professional - dynatrace master partner - Matrix Soft Ware Division - Israel
Options
- Mark as New
- Subscribe to RSS Feed
- Permalink
29 Mar 2020 04:03 PM
Hello @Yos N.
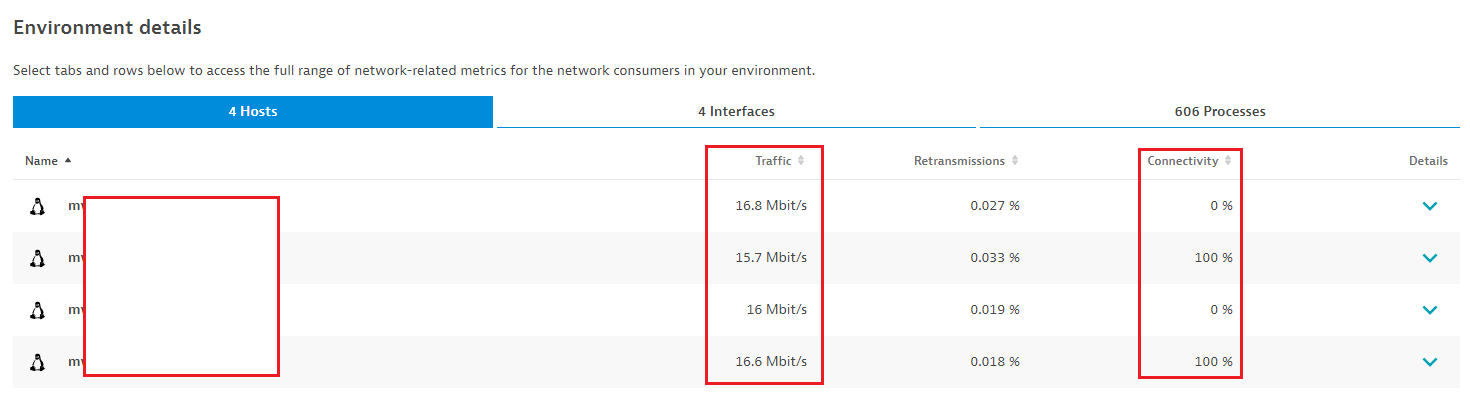
My question is different than this. Have a look at the below screenshot. Its a 4 hosts group, 2 are showing 0% connectivity and the other 2 are showing 100% connetivity while the traffic is almost similar.
Regards,
Babar
1585494120828.png
35 KB
Options
- Mark as New
- Subscribe to RSS Feed
- Permalink
29 Mar 2020 04:12 PM
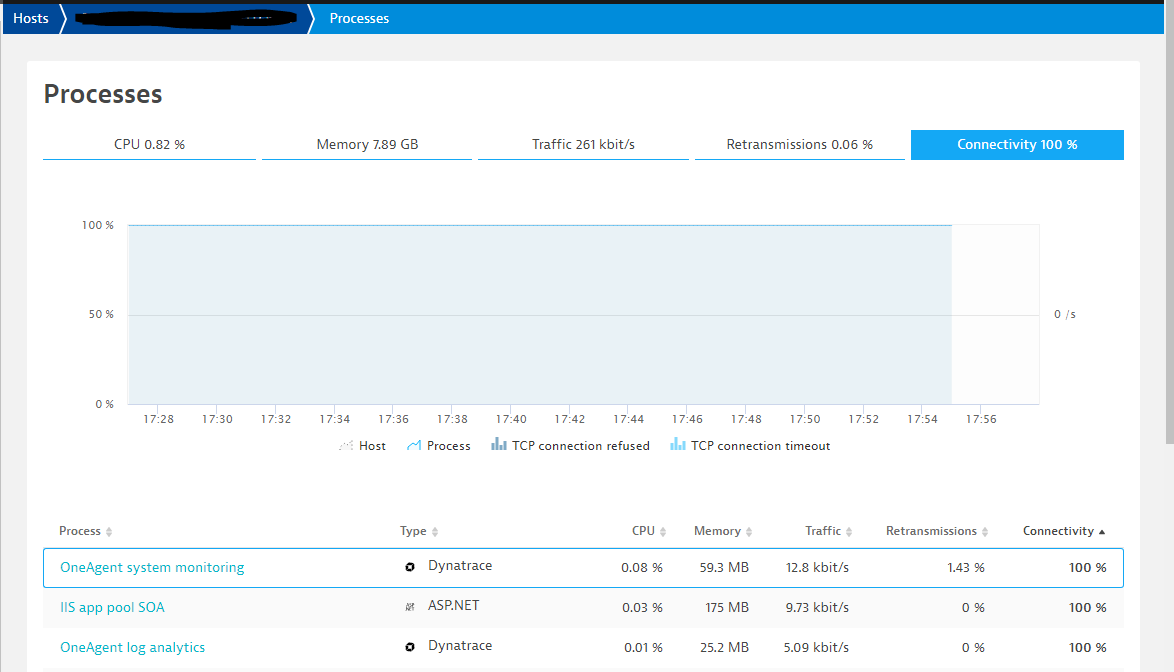
Let's try to check first what causing those hosts to show 0% connectivity by checking the processes connectivity.
Can you please show the connectivity of the processes of one of the hosts with 0% connectivity, sort the processes by the connectivity to see which of the processes are refusing connection ...
And also take a look a this thread which explain what is the meaning of Host connectivity metric.
HTH
Yos
dynatrace certificated professional - dynatrace master partner - Matrix Soft Ware Division - Israel
Options
- Mark as New
- Subscribe to RSS Feed
- Permalink
30 Mar 2020 07:20 AM
Hello @Yos N.
Than you for sharing the thread.
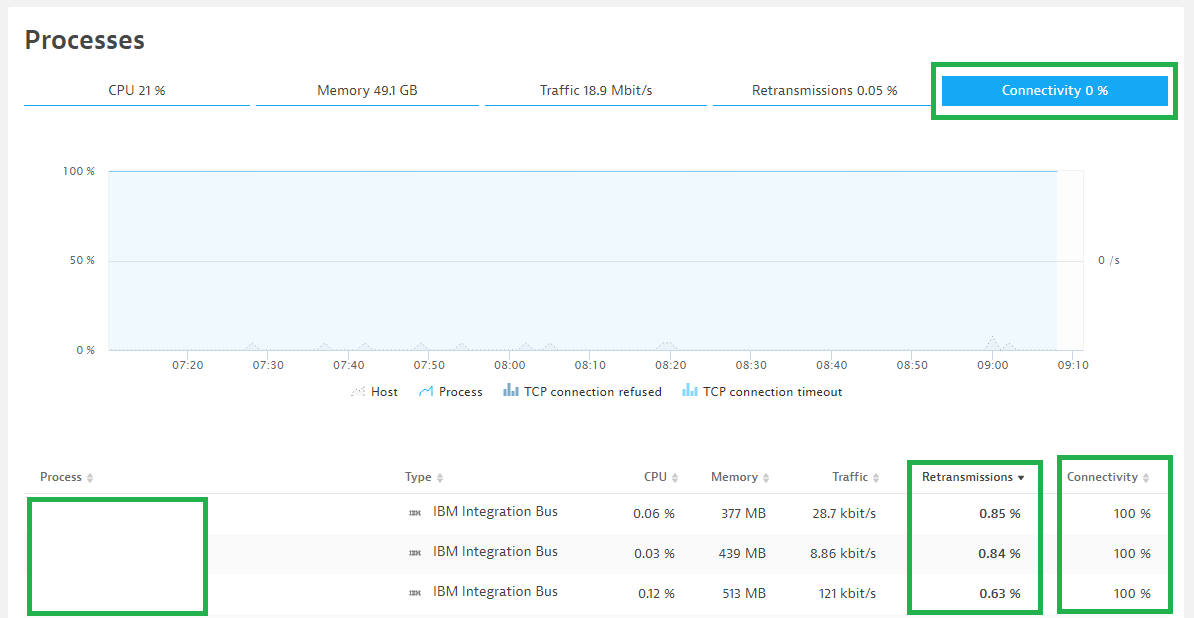
The below host showing 0% connectivity while you can see that maximum retransmission is 0.85% for one of the following processes, but the connectivity is 100%.
The host which is showing 100% connectivity has a maximum retransmission of 0.93% for one of the processes.
Regards,
Babar
Options
- Mark as New
- Subscribe to RSS Feed
- Permalink
30 Mar 2020 07:33 AM
HI @Babar Q.
So its look like your application processes are connected OK, that the good part. Are there other processes down under the list of processes?
Yos
dynatrace certificated professional - dynatrace master partner - Matrix Soft Ware Division - Israel
Options
- Mark as New
- Subscribe to RSS Feed
- Permalink
30 Mar 2020 08:19 AM
Hello @Yos N.
As I shared earlier that everything is similar among 0% connectivity and 100% connectivity hosts.
Regards,
Babar
Options
- Mark as New
- Subscribe to RSS Feed
- Permalink
30 Mar 2020 04:29 PM
Ammm its look like the blame here is on Host connections good question for dynatrace one I think 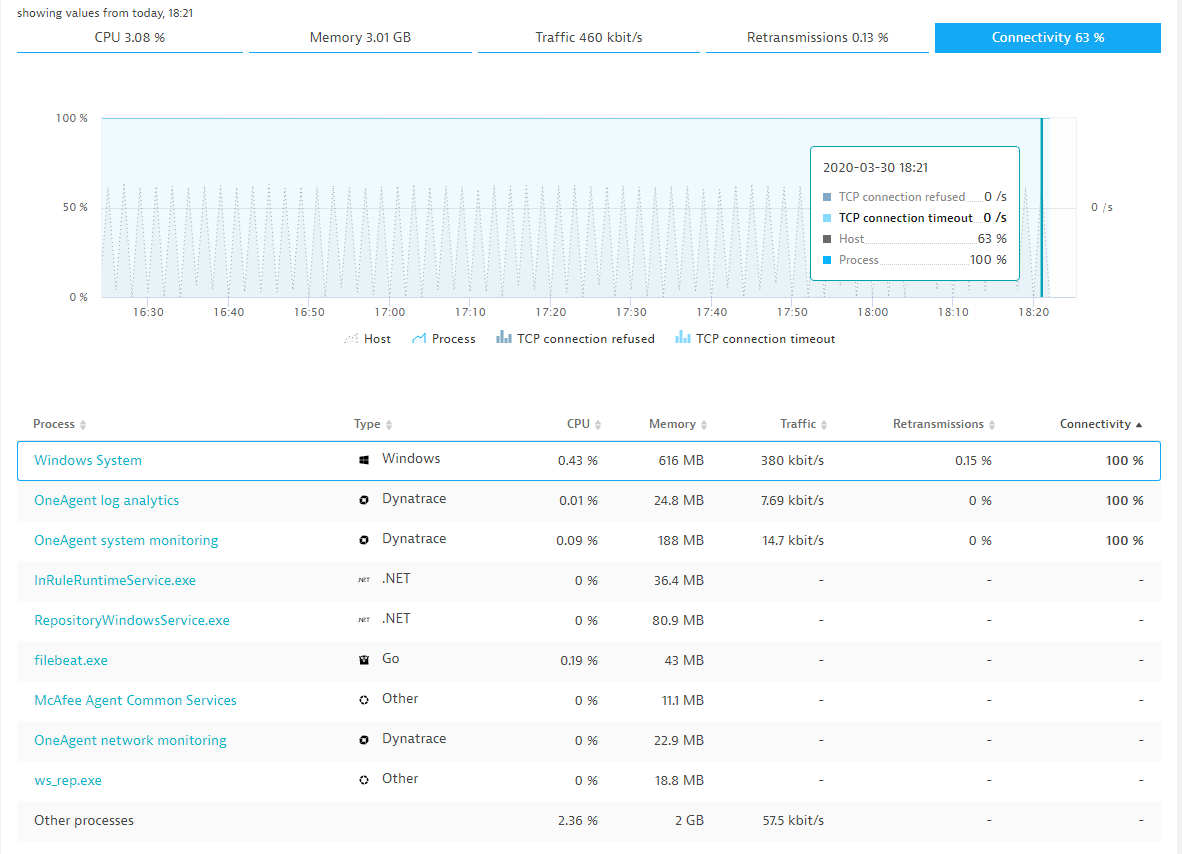
dynatrace certificated professional - dynatrace master partner - Matrix Soft Ware Division - Israel
Options
- Mark as New
- Subscribe to RSS Feed
- Permalink
31 Mar 2020 06:10 AM
Hello @Yos N.
Yes. It seems time to go to Dynatrace ONE/or Support to understand such type of cases.
Regards,
Babar
Featured Posts
