- Dynatrace Community
- Ask
- Dashboarding
- What is on Y axis of Replication Status SAP hana DB in Data Explorer?
- Subscribe to RSS Feed
- Mark Topic as New
- Mark Topic as Read
- Pin this Topic for Current User
- Printer Friendly Page
- Mark as New
- Subscribe to RSS Feed
- Permalink
01 Aug 2022
06:49 AM
- last edited on
24 May 2023
12:06 PM
by
![]() Michal_Gebacki
Michal_Gebacki
Hi Team,
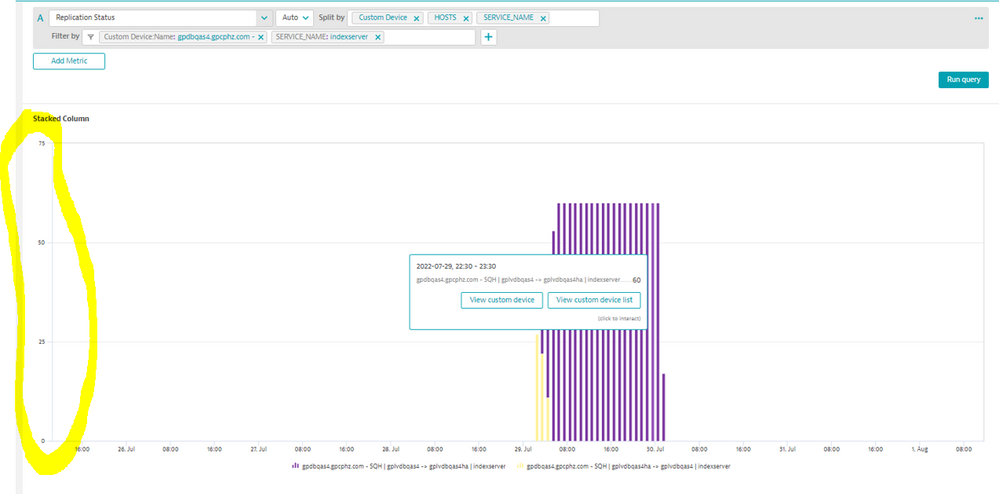
I am trying to create an alert that notifies when SAP DB HANA FAilover Happens, in Data Explorer I am checking for Replication Status for HANA DB and I see a number on Y-Axis that changes frequently from 100-1000's, can you please explain what is the number and how do I read it to make sense.
Thanks in Advance.
Solved! Go to Solution.
- Mark as New
- Subscribe to RSS Feed
- Permalink
03 Aug 2022 02:50 PM
Hi @Lukesh_DEL ,
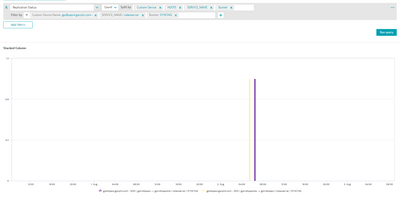
The reason the values are so high is because you are using the "auto" aggregation (which appears to be the same as the "sum" aggregation). If you switch it to count you should see data more in line with what you expect.
I also see that you are trying to chart a state metric which also includes a dimension of "bucket". These are the actual states while the count is how many times for that minute the metric was in that "state". Can you please add the bucket dimension to the splitting. This will show you the different states the DBs are in.
I also see you are interested in alerting (https://community.dynatrace.com/t5/Alerting/How-do-I-create-an-alert-from-Custom-Anomalies-detection...) If you filter by the SYNCING bucket, it should show you when the failover's occur. You can then create a custom event whenever this metric is above 0.
Thanks,
David
Featured Posts


