This website uses Cookies. Click Accept to agree to our website's cookie use as described in our Privacy Policy. Click Preferences to customize your cookie settings.
Dynatrace Managed Q&A
Turn on suggestions
Auto-suggest helps you quickly narrow down your search results by suggesting possible matches as you type.
Looking to upgrade from Dynatrace Managed to SaaS?
See how
- Community Home
- Platform
- Dynatrace Managed Q&A
- Re: Getting total processing time for asynchronous processes like Kafka on Dynatrace Managed
Options
- Subscribe to RSS Feed
- Mark Topic as New
- Mark Topic as Read
- Pin this Topic for Current User
- Printer Friendly Page
Getting total processing time for asynchronous processes like Kafka on Dynatrace Managed
Options
- Mark as New
- Subscribe to RSS Feed
- Permalink
25 Mar 2026
03:42 AM
- last edited on
25 Mar 2026
08:08 AM
by
![]() MaciejNeumann
MaciejNeumann
Hi all,
The response and processing times of e2e traces do not account for asynchronous processing like Kafka. Is there a way to get that timing in Dynatrace Managed? I have also looked for a workaround via calculated service metrics, using the processing time as the metric source, and splitting by service name and X-CorrelationID in order to get the individual timings for each service per X-CorrelationID. However, I am seeing <missing> values for X-CorrelationID.
My questions are:
1. Is there no way to capture e2e processing times in Dynatrace Managed, without Grail?
2. What is the reason for the <missing> values for X-CorrelationID?
Regards,
LS
Labels:
5 REPLIES 5
Options
- Mark as New
- Subscribe to RSS Feed
- Permalink
25 Mar 2026 06:25 AM - edited 25 Mar 2026 06:25 AM
Hi,
when it comes to Kafka, it’s a bit more complex, but to start with, I’d like to ask on your Kafka servers, are you using full-stack deployment, or are you only using the Kafka extension?
Options
- Mark as New
- Subscribe to RSS Feed
- Permalink
25 Mar 2026 06:57 AM
Hi
@JAWLS
I understand that you mentioned earlier you are using trace context as part of the correlation ID, but from what you’re describing, it seems like the context isn’t being propagated into Kafka messages. As a result, Dynatrace is unable to display Kafka calls within distributed traces.
Could I please ask you for a screenshot? When you go to Message queues → any topic → click on “Producer services” → and then navigate to Distributed traces, there should be traces that include Kafka calls.
Options
- Mark as New
- Subscribe to RSS Feed
- Permalink
25 Mar 2026 07:30 AM
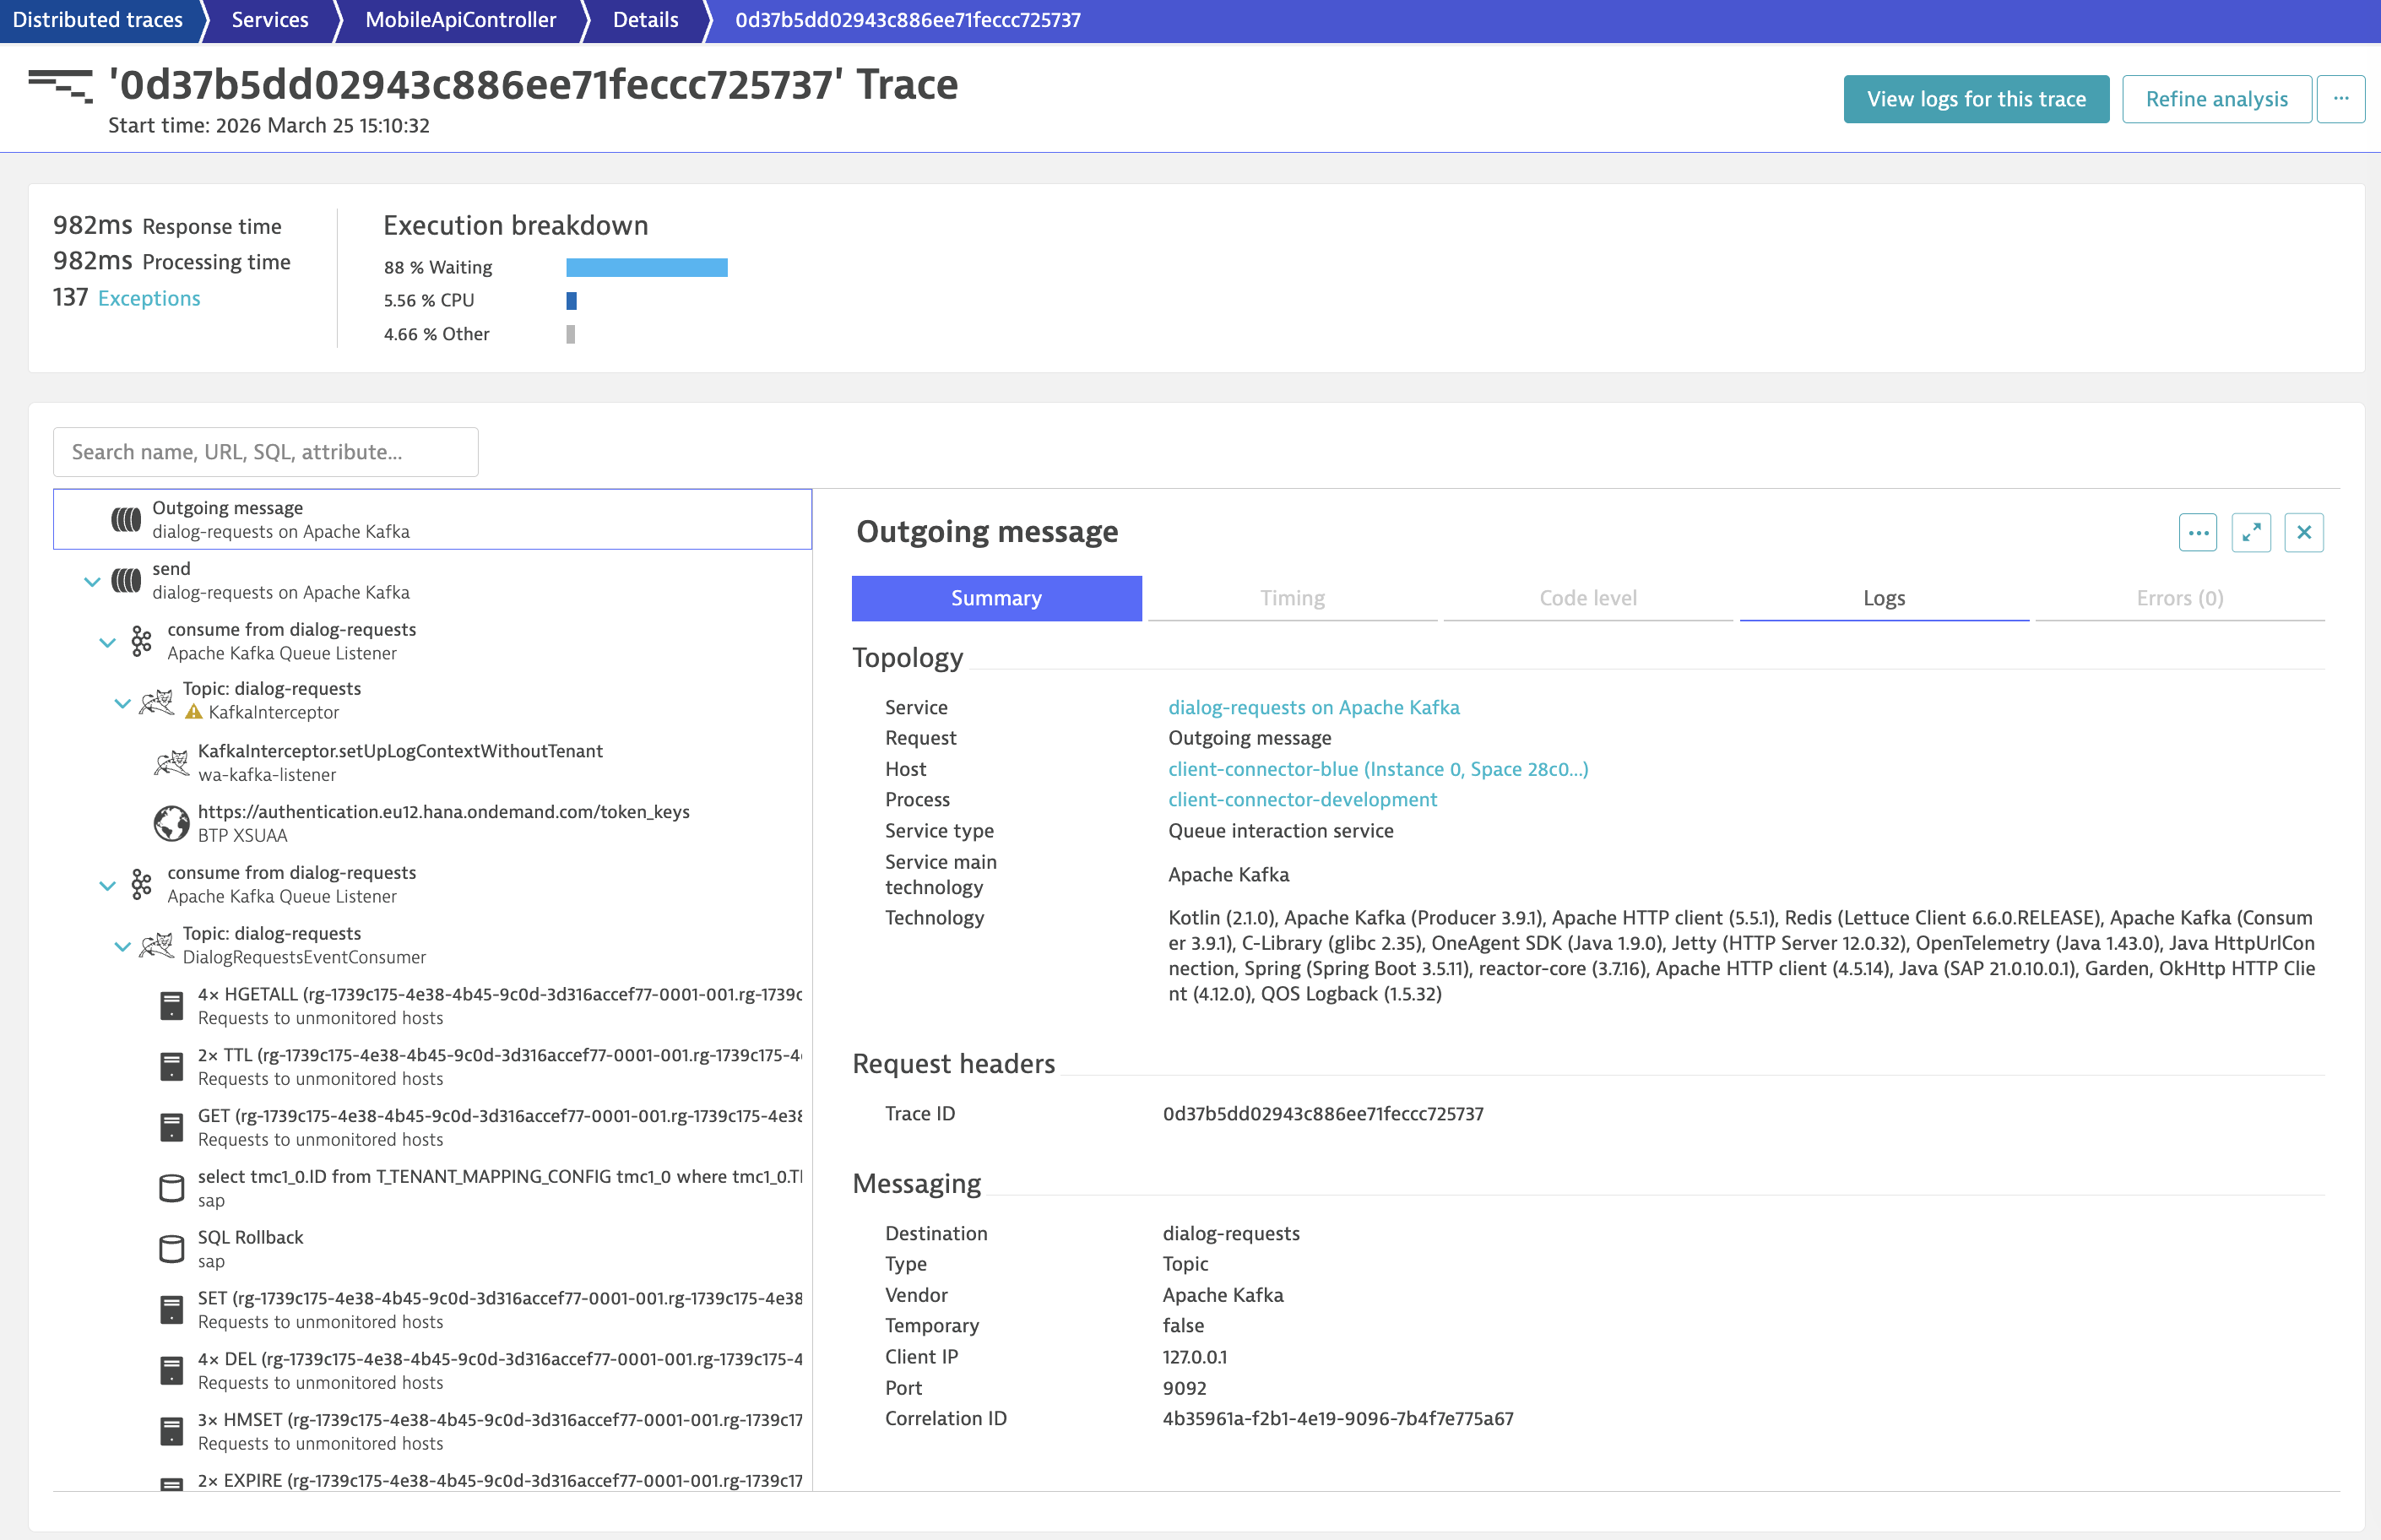
I have attached the distributed traces. Seems like the Correlation ID is tagged to the Kafka calls? Am I missing something?
For more information, when I created the calculated service metrics, in the Preview, I see "Requests executed in background threads of SpringBoot ..." I have also attached the calculated service metrics details.
Options
- Mark as New
- Subscribe to RSS Feed
- Permalink
25 Mar 2026 09:47 AM
Unfortunately, this suggests that OneAgent is not able to capture the trace context within the call. It’s possible that the context isn’t being injected at all, or that something is overwriting it.It could also be caused by using an older Kafka client or a custom-modified library. A potential solution would be to implement manual tracing using OpenTelemetry if OneAgent isn’t able to handle it natively.Alternatively, it would be a good idea to contact Dynatrace support for a more thorough evaluation of the situation.
Featured Posts
