This website uses Cookies. Click Accept to agree to our website's cookie use as described in our Privacy Policy. Click Preferences to customize your cookie settings.
Open Q&A
If there's no good subforum for your question - ask it here!
Turn on suggestions
Auto-suggest helps you quickly narrow down your search results by suggesting possible matches as you type.
- Community Home
- Platform
- Open Q&A
- CPU Saturation showing “CPU idle threshold below 5%” despite custom 70% threshold
Options
- Subscribe to RSS Feed
- Mark Topic as New
- Mark Topic as Read
- Pin this Topic for Current User
- Printer Friendly Page
CPU Saturation showing “CPU idle threshold below 5%” despite custom 70% threshold

Options
- Mark as New
- Subscribe to RSS Feed
- Permalink
07 Sep 2026 01:30 PM
Hi Dynatrace Team,
We have configured CPU anomaly detection / CPU saturation with a custom threshold of 70% CPU usage.
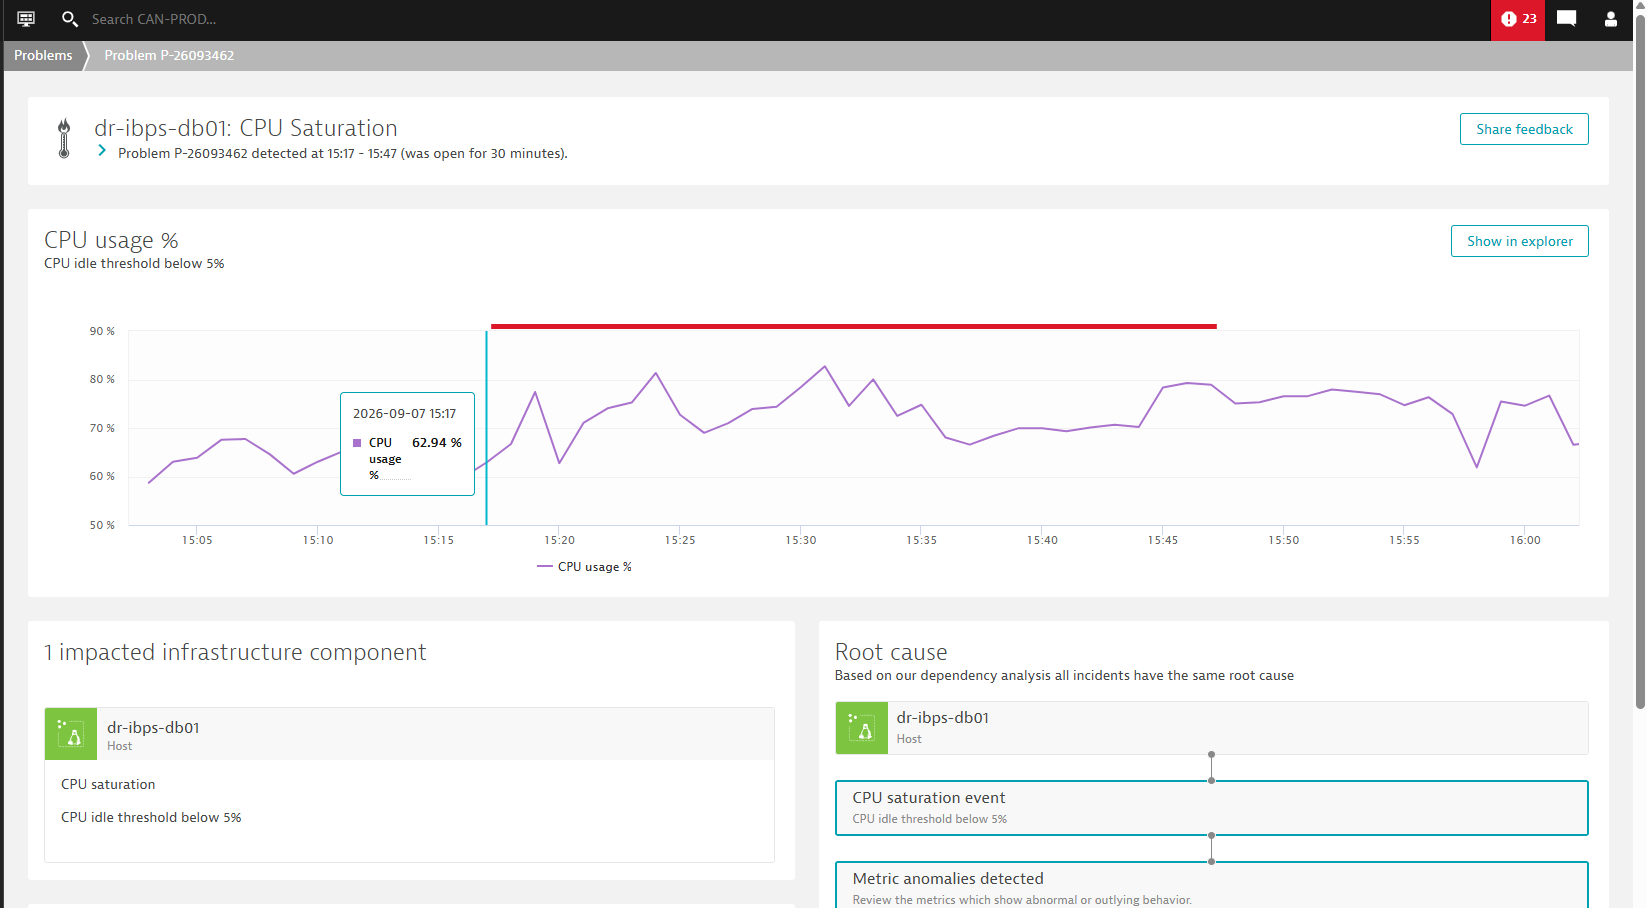
However, when a CPU Saturation problem is generated, the Problem page shows:
CPU idle threshold below 5%
Please refer to the attached screenshot.
For example, for host dr-ibps-db01, the Problem page shows CPU Saturation – CPU idle threshold below 5%, while the CPU usage shown in the graph is mostly around 60–82%.
We would like to understand the following:
- Why is the Problem page showing “CPU idle threshold below 5%” instead of our configured 70% CPU usage threshold?
- Are CPU anomaly detection at 70% and CPU Saturation (CPU idle below 5%) separate detection mechanisms?
- If the CPU usage crosses 70% but does not reach 95%, should Dynatrace generate a CPU anomaly/problem?
- Which configuration controls the “CPU idle threshold below 5%” displayed in the Problem page?
- Is the 5% CPU idle threshold equivalent to approximately 95% CPU utilization, and is this the default CPU Saturation threshold?
- If we want CPU Saturation to trigger at 70% CPU utilization, which setting should we modify?
Could you please clarify how the 70% threshold and 5% CPU idle threshold are related and why the Problem page is displaying the latter?
Thanks in advance for your help.
Labels:
- Labels:
-
anomaly detection
-
cpu
0 REPLIES 0

Featured Posts
