This website uses Cookies. Click Accept to agree to our website's cookie use as described in our Privacy Policy. Click Preferences to customize your cookie settings.
Open Q&A
If there's no good subforum for your question - ask it here!
Turn on suggestions
Auto-suggest helps you quickly narrow down your search results by suggesting possible matches as you type.
- Community Home
- Platform
- Open Q&A
- Re: CPU Saturation showing “CPU idle threshold below 5%” despite custom 70% threshold
Options
- Subscribe to RSS Feed
- Mark Topic as New
- Mark Topic as Read
- Pin this Topic for Current User
- Printer Friendly Page
CPU Saturation showing “CPU idle threshold below 5%” despite custom 70% threshold

Options
- Mark as New
- Subscribe to RSS Feed
- Permalink
07 Sep 2026 01:30 PM
Hi Dynatrace Team,
We have configured CPU anomaly detection / CPU saturation with a custom threshold of 70% CPU usage.
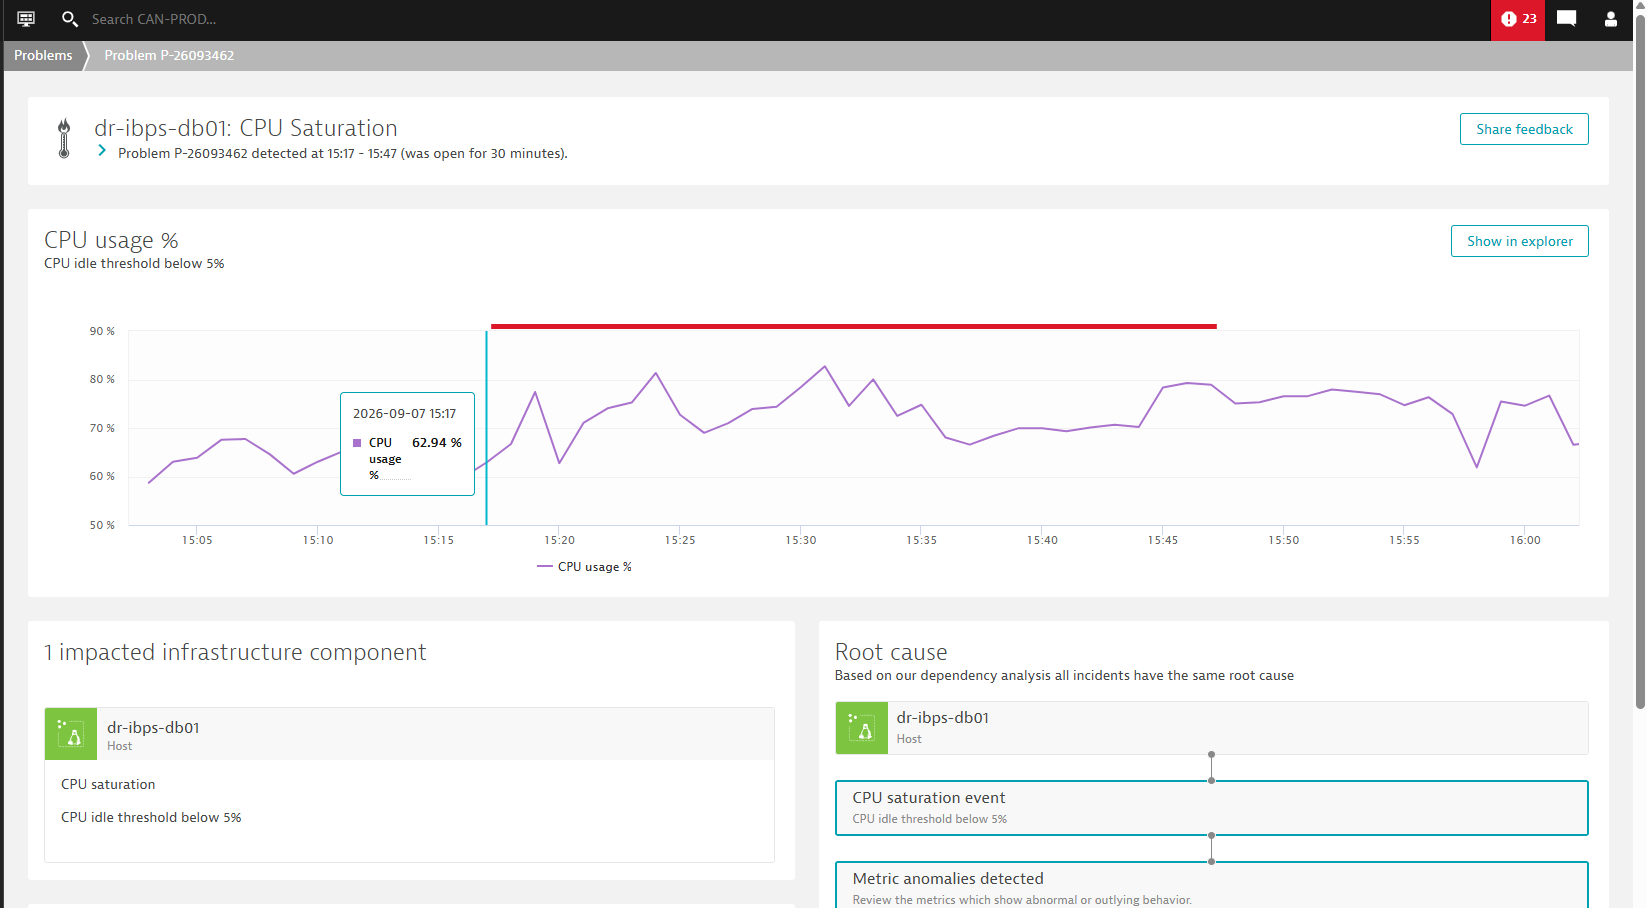
However, when a CPU Saturation problem is generated, the Problem page shows:
CPU idle threshold below 5%
Please refer to the attached screenshot.
For example, for host dr-ibps-db01, the Problem page shows CPU Saturation – CPU idle threshold below 5%, while the CPU usage shown in the graph is mostly around 60–82%.
We would like to understand the following:
- Why is the Problem page showing “CPU idle threshold below 5%” instead of our configured 70% CPU usage threshold?
- Are CPU anomaly detection at 70% and CPU Saturation (CPU idle below 5%) separate detection mechanisms?
- If the CPU usage crosses 70% but does not reach 95%, should Dynatrace generate a CPU anomaly/problem?
- Which configuration controls the “CPU idle threshold below 5%” displayed in the Problem page?
- Is the 5% CPU idle threshold equivalent to approximately 95% CPU utilization, and is this the default CPU Saturation threshold?
- If we want CPU Saturation to trigger at 70% CPU utilization, which setting should we modify?
Could you please clarify how the 70% threshold and 5% CPU idle threshold are related and why the Problem page is displaying the latter?
Thanks in advance for your help.
Labels:
- Labels:
-
anomaly detection
-
cpu
5 REPLIES 5


Options
- Mark as New
- Subscribe to RSS Feed
- Permalink
08 Sep 2026 01:37 AM
@Sohel_Rashid The problem that is raised is actually raised by the 70% custom threshold that was set , however the event description for the CPU saturation events is hard coded to display "CPU idle threshold below 5%" by default even though CPU idle may not be at 5% . Its not a dynamic value that gets updated, its a static event description .
By default, Dynatrace generates CPU saturation event when average CPU usage is higher than 95% and "CPU idle threshold below 5%" description is set for that . When you change it to custom threshold , the description does not get updated .
Its a limitation, but you can safely ignore it
Phani Devulapalli
Reply

Options
- Mark as New
- Subscribe to RSS Feed
- Permalink
08 Sep 2026 05:10 AM
Jumping in here as this is a common point of confusion ,the explanation above is accurate.
To add a bit more context for anyone else hitting this:
Dynatrace's CPU Saturation detection defaults to firing when average CPU usage exceeds 95% (i.e., idle drops below 5%), and that's where the "CPU idle threshold below 5%" text in the problem description originates.
When you override this with a custom threshold (e.g., 70%) under Settings, the detection logic correctly uses your custom value but the event description text is static and doesn't reflect the custom setting. It always shows the default wording regardless of what triggered it.
So functionally, everything is working as configured; it's purely a cosmetic/reporting gap in how the problem card renders the description.
Thanks,
Sujit
Dynatrace Professional Certified
Reply
Options
- Mark as New
- Subscribe to RSS Feed
- Permalink
08 Sep 2026 06:29 AM
Hi @sujit_k_singh and @p_devulapalli
Thanks for the detailed clarification. Since we have configured a custom CPU Saturation threshold of 70%, ideally the Problem description should reflect the configured threshold rather than showing “CPU idle threshold below 5%.” This has also been highlighted during our audit, as the current wording can create a misconception that the threshold is still set to 5%. Could you please advise how we can change/update this description to reflect the actual 70% configured threshold, or whether there is any recommended workaround?
Thanks,
Sohel
Options
- Mark as New
- Subscribe to RSS Feed
- Permalink
08 Sep 2026 07:56 AM
@Sohel_Rashid Not sure you would be able to update the description for default events, alternate option would be to use the new Alert Management (Anomaly Detection app) option to setup thresholds and alerting as its more flexible
https://docs.dynatrace.com/docs/dynatrace-intelligence/anomaly-detection/anomaly-detection-app
Phani Devulapalli


Options
- Mark as New
- Subscribe to RSS Feed
- Permalink
08 Sep 2026 02:10 PM
Hi @Sohel_Rashid ,
The problem description is working as designed. Although the problem statement indicates that CPU idle is below 5%, the chart displays CPU usage, where CPU idle is calculated as: CPU Idle = 100% - CPU Usage
As a result, when CPU usage is near 100%, CPU idle is correspondingly below 5%, which matches the condition that triggered the problem. For an example the graph shows CPU usage approaching 100%, indicating that CPU idle was indeed below the configured threshold.
I hope this helps clarify the behavior you're seeing.
The title and description of the built-in CPU saturation event can't currently be customized. The text "CPU idle threshold below 5%" is a predefined description for the built-in event and doesn't automatically reflect custom threshold values that you configure.
As a workaround, you can customize the notification payload sent to JSP Ops and use your own title/description instead of the default problem title and description. This avoids having to create custom metric events or anomaly detectors for all hosts.
Unfortunately, there is currently no global setting in Dynatrace to rename the standard CPU saturation event or update its displayed description.

Featured Posts
