- Dynatrace Community
- Ask
- Open Q&A
- Expand the Dashboard tile into a large view (pop up)
- Subscribe to RSS Feed
- Mark Topic as New
- Mark Topic as Read
- Pin this Topic for Current User
- Printer Friendly Page
- Mark as New
- Subscribe to RSS Feed
- Permalink
21 Sep 2023
09:05 AM
- last edited on
21 Sep 2023
09:31 AM
by
![]() Ana_Kuzmenchuk
Ana_Kuzmenchuk
ive created a dashbaord with like 10 things that we regards as KPI metrics for a stress test,
CPU
Memory
HTTP errors
GC errors
GC Cycles
availability
database calls
This is agreat dashboard because it gives you all the info in a single glass pane view, now the problem is each of the tiles is tiny and you cannot even make out the X or Y axis labels, can we please have a click button on any tile that will simply expand the tile into a large view {pop up} at the moment i have to click and go to explorer which is still ok but its a different view, why can we not just have the same view on a larger screen
Solved! Go to Solution.
- Labels:
-
dashboards
- Mark as New
- Subscribe to RSS Feed
- Permalink
21 Sep 2023 10:12 AM - edited 21 Sep 2023 10:13 AM
Hi,
Unfortunately this is not possible. You can only click on a particular tile on the dashboard and see the details on a separate tab (for eg. Data Explorer).
Radek
- Mark as New
- Subscribe to RSS Feed
- Permalink
21 Sep 2023 10:22 AM
Hi @Jamz,
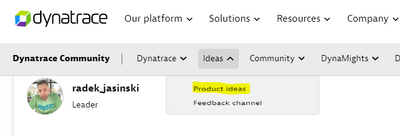
Surely an interesting idea, some dashboarding tools offer that indeed. I would suggest this to Dynatrace via the product ideas so that they can review it. GRAIL brings a lot more dashboarding options so maybe it would only be integrated there.
- Mark as New
- Subscribe to RSS Feed
- Permalink
21 Sep 2023 11:25 AM
thanks for this Marina i will do this now
- Mark as New
- Subscribe to RSS Feed
- Permalink
22 Sep 2023 07:57 AM
Product idea is here.
Featured Posts

