This website uses Cookies. Click Accept to agree to our website's cookie use as described in our Privacy Policy. Click Preferences to customize your cookie settings.
Open Q&A
If there's no good subforum for your question - ask it here!
Turn on suggestions
Auto-suggest helps you quickly narrow down your search results by suggesting possible matches as you type.
- Community Home
- Platform
- Open Q&A
- Re: Queries per request in Dynatrace
Options
- Subscribe to RSS Feed
- Mark Topic as New
- Mark Topic as Read
- Pin this Topic for Current User
- Printer Friendly Page
Options
- Mark as New
- Subscribe to RSS Feed
- Permalink
09 Mar 2021
06:44 PM
- last edited on
10 Mar 2021
06:57 AM
by
![]() Karolina_Linda
Karolina_Linda
HI all,
I have 2 view, top requests and number of calls to databases.
What I'd like to see is which requests make the most database calls?
Thank you.
Solved! Go to Solution.
Labels:
- Labels:
-
databases
3 REPLIES 3
Options
- Mark as New
- Subscribe to RSS Feed
- Permalink
10 Mar 2021 08:30 AM
Hello @msmith1
Try the following method:
Using Diagnostic tools > To web requests > Service-level backtrace of requests/ or service flow.
Regards,
Babar
Reply
Options
- Mark as New
- Subscribe to RSS Feed
- Permalink
29 Mar 2021 05:10 PM
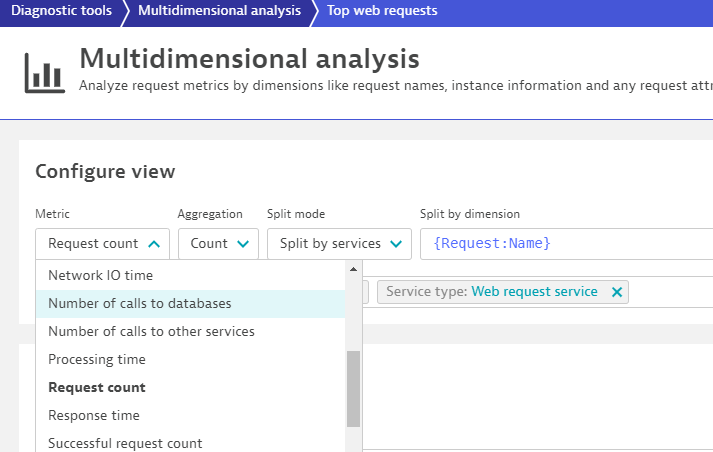
Once you're at the view Babar mentioned, you'll want to change the metric you are displaying.
This metric is also available to query through the Metrics v2 API or plot in a dashboard.
Reply
Options
- Mark as New
- Subscribe to RSS Feed
- Permalink
07 Apr 2021 02:08 PM
Thank you for replying, my apologies for my delayed response.
This is what I had in appmon and this is what I have in dynatrace. The requests outweigh the db calls it's hard to see an actual trend (and that's just 7 days worth).
Any suggestions?
thanks


Featured Posts
