This website uses Cookies. Click Accept to agree to our website's cookie use as described in our Privacy Policy. Click Preferences to customize your cookie settings.
Real User Monitoring
User session monitoring, key user actions - everything RUM.
Turn on suggestions
Auto-suggest helps you quickly narrow down your search results by suggesting possible matches as you type.
- Dynatrace Community
- Ask
- Real User Monitoring
- What does the processing signify in this popup?
Options
- Subscribe to RSS Feed
- Mark Topic as New
- Mark Topic as Read
- Pin this Topic for Current User
- Printer Friendly Page
Options
- Mark as New
- Subscribe to RSS Feed
- Permalink
29 Aug 2017 04:39 PM
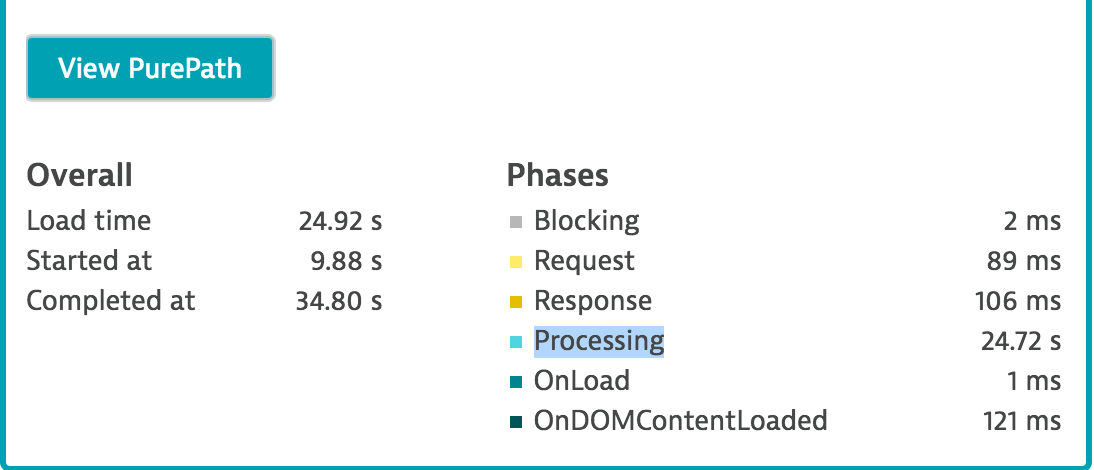
I am newbie to Dynatrace and am analysing a slow performing request in the Waterfall analysis.
What i dont understand is what does the processing part of the graph allude to? Is it the DOM processing or the server processing or something completely different?

Solved! Go to Solution.
Labels:
1 REPLY 1
Options
- Mark as New
- Subscribe to RSS Feed
- Permalink
29 Aug 2017 05:21 PM
Hi,
These metrics are all based on the browser and mainly based on the navigation timings. Therefore this is the DOM processing. Please take a look at processing model of: https://www.w3.org/TR/navigation-timing/
Featured Posts
