- Dynatrace Community
- Ask
- Alerting
- Re: Custom Alert for Available Disk Space
- Subscribe to RSS Feed
- Mark Topic as New
- Mark Topic as Read
- Pin this Topic for Current User
- Printer Friendly Page
- Mark as New
- Subscribe to RSS Feed
- Permalink
20 Oct 2021
07:54 PM
- last edited on
16 Mar 2023
03:01 PM
by
![]() Ana_Kuzmenchuk
Ana_Kuzmenchuk
I am trying to make it possible so that certain machines inform me when they are under 200GB disk space. The end goal is to alert if Available Disk drops below 200GB for all drives that have a capacity of 1TB or more and only for machines tagged as Physical.
I have tried using the following:
- Global Disk Usage Anomaly
- Host Disk Usage Anomaly
- Create Custom Event for Alerting
- Building query in Data Explorer
These options only allow me to enter a % (% that disk space drops below to be alerted on), where I need to enter "200GB". The custom event for alerting option allows me to enter 200GB, but I cannot split by host, only by disk, so this won't work. Can anyone help me with this?
Solved! Go to Solution.
- Labels:
-
hosts classic
-
problems classic
-
threshold
- Mark as New
- Subscribe to RSS Feed
- Permalink
22 Oct 2021 08:19 PM - edited 22 Oct 2021 08:19 PM
I believe the disk available metric "builtin:host.disk.avail" will alert on the sum of disks on a host, so if you set a threshold for 200GB using that metric as a custom event for alerting, a problem should be generated for each host (sum of disks) that crosses the threshold
- Mark as New
- Subscribe to RSS Feed
- Permalink
22 Oct 2021 08:29 PM
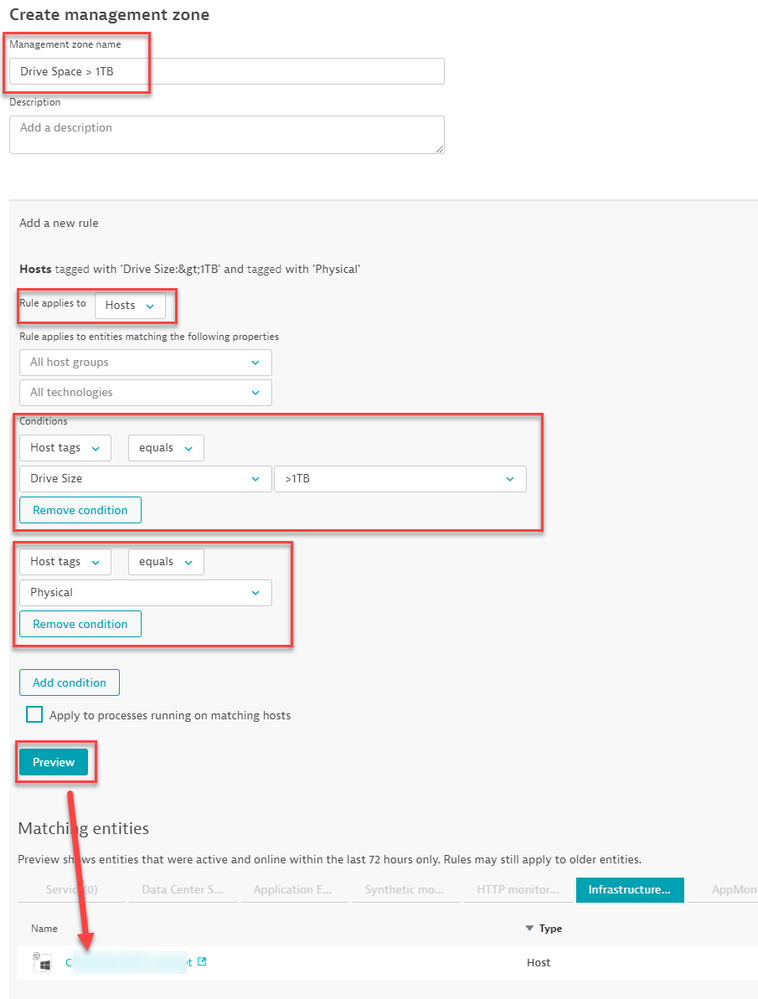
You might need to incorporate a few different things. First I don't think we can leverage auto tags based off of drive size - RFE could be put in for that. What you could do is set a manual tag; "Drive Size:>1TB" I've also added a tag manually called physical for your use case but you can leverage this via auto tags.
Once you have tagged (manually) the Hosts that have a drive space larger then 1TB, you can then set a Management Zone. You can call it what ever you want, I just call it Drive Space > 1TB.
You don't need to have the extra condition of physical if you want to grab everything > 1TB, but if you want to isolate pHysical vs virtual and or cloud then you can add in that condition.
This Management Zone can be, but isn't going to be used in the conventional sense. Its more so for the custom event for alerting.
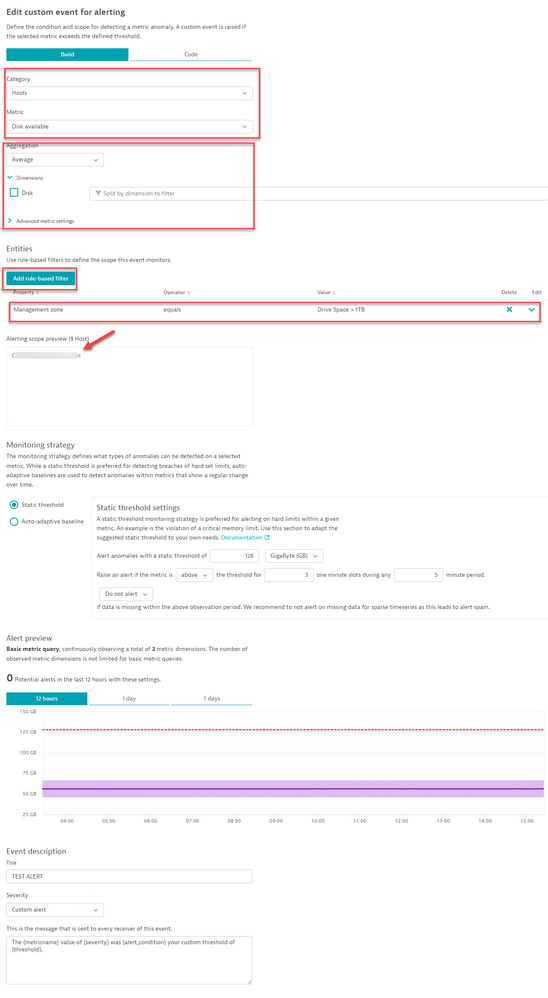
Navigate to the custom event for alerting and set it as the following:
Now feel free to adjust it as you see fit. the core aspect is to set the Management Zone as this reduces your scope to the hosts included in that MZ. You could also leverage the Tag as a rule based filter but its only one rule at a time so you cant have one with Physical and >1TB, hence the MZ method.
I hope this helps! Granted it might be a big ask to tag each host one by one with the tag. You could always leverage auto tags and provide a condition as long as the host names contain Regex = <Values> but that's up to you. If its a handful of servers it might not be a problem for manual tagging
- Mark as New
- Subscribe to RSS Feed
- Permalink
14 Apr 2024 06:48 AM
Hi Chad
My request is simple. we have 150 hosts. we need disk space greater than 10% to be alerted as slowdown event. Could you please provide step by step process here?
- Mark as New
- Subscribe to RSS Feed
- Permalink
15 Apr 2024 01:28 PM
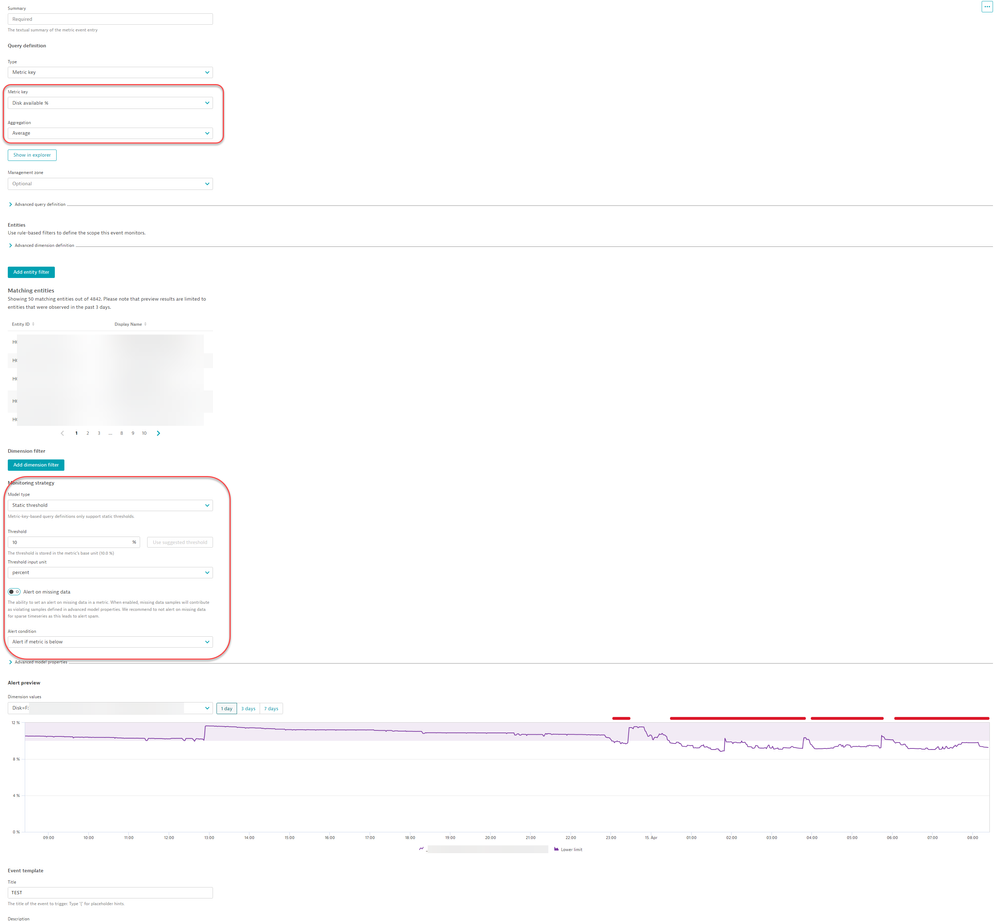
sure thing, Please feel free to add in any needed filters for drive letters etc...
This is a custom metric that you can make via the Settings>Anomaly Detection>Metric Events:
- Mark as New
- Subscribe to RSS Feed
- Permalink
16 Apr 2024 12:09 PM
Hi Chad - when i do the setting - alerts are getting for all servers even though sufficient diskspace. any reason. what needs to be corrected
- Mark as New
- Subscribe to RSS Feed
- Permalink
16 Apr 2024 12:27 PM
Sounds like you have your over/under for the triggering of the alert swapped. Selected the other one and check the alert preview as shown in the screen shot.
- Mark as New
- Subscribe to RSS Feed
- Permalink
16 Apr 2024 02:59 PM
Sorry chad,. which one i need to select from above screenshot
- Mark as New
- Subscribe to RSS Feed
- Permalink
16 Apr 2024 03:19 PM
My screen shot has Below set
- Mark as New
- Subscribe to RSS Feed
- Permalink
16 Apr 2024 03:23 PM
Sorry chad, i am not able to see any screenhot
- Mark as New
- Subscribe to RSS Feed
- Permalink
16 Apr 2024 03:46 PM
Hi Chad
Please find the attached document which has settings. what we need his to send alerts of disk space is less than 10% of threshold. please review
- Mark as New
- Subscribe to RSS Feed
- Permalink
16 Apr 2024 04:04 PM
as mentioned, you alert criteria is set to above. You need to change it to below. Right now your rule is sending alerts for any hosts that have more than 10% free space... so 12%, 20%, 30%, 80% free space are all alerting. If you selected Below, anything below 10% free space will alert... so 9%, 7%, 2%, 1%
- Mark as New
- Subscribe to RSS Feed
- Permalink
16 Apr 2024 04:38 PM
Thanks. can we CPU Usage% as metric key to get alerts if CPU Usage is above 90%?
- Mark as New
- Subscribe to RSS Feed
- Permalink
16 Apr 2024 04:42 PM
correct, same methodology
- Mark as New
- Subscribe to RSS Feed
- Permalink
17 Apr 2024 04:08 AM
Hi Chad - Below is the descritpion
Entity Host Name - {dims:dt.entity.host.name}
Disk - {dims:dt.entity.disk} - This is not displaying actual drive
Metric Name - {metricname}
Current value - {severity}
Alert Condition - {alert_condition}
Threshold - {threshold}
Disk - {dims:dt.entity.disk} - This is not displaying actual drive. How to display actaul drive - like C: and 😧
- Mark as New
- Subscribe to RSS Feed
- Permalink
26 Apr 2024 03:13 AM
Hi Chad
Thanks for help, this issue resolve. one more request. we want to set up disk alerts.
>85% to 89% - Minor incident - How do we do this.
>90 - Major incident. - we have this already setup as per your recommedndation
- Mark as New
- Subscribe to RSS Feed
- Permalink
29 Apr 2024 12:30 PM - edited 29 Apr 2024 12:31 PM
same as how you set up the other, however you cannot set a range form X - Y, it will be from X and above.
- Mark as New
- Subscribe to RSS Feed
- Permalink
29 Apr 2024 01:14 PM
Thanks. We already have alert less than 10,%. Could you please share screenshot how to do if it is less than 15%
Basically two alerts
One when it is 15% available space
Second when it is 10% available space
- Mark as New
- Subscribe to RSS Feed
- Permalink
05 Oct 2021
12:36 PM
- last edited on
06 Oct 2021
12:53 PM
by
![]() MaciejNeumann
MaciejNeumann
Currently, we are struggling with file system alerting. There are 2 possibilities, Thresholds on % or Thresholds on values.
As we have different types of filesystems (smaller ones & bigger ones) it is no option to choose between these options. A threshold of 85% on a 5Gb filesystem is ok, but on a 1TB filesystem, it means that 150 Gb remains, which is not a good threshold.
For the same reasons, a threshold on values is not valuable for both kinds of filesystems.
Does anyone have a solution for this situation? We get the response, works as designed, but this design does not work for our environment.
-Monique-
- Mark as New
- Subscribe to RSS Feed
- Permalink
27 Oct 2021 02:24 PM
You could allow Davis to baseline the disks from the settings and/or from a custom event for alerting.
- Mark as New
- Subscribe to RSS Feed
- Permalink
27 Oct 2021 07:39 PM
A similar discussion is occurring over here: https://community.dynatrace.com/t5/Dynatrace-Open-Q-A/Custom-Alert-for-Available-Disk-Space/m-p/1744...
- Mark as New
- Subscribe to RSS Feed
- Permalink
27 Oct 2021 09:24 PM
I've merged the two 🙂
Featured Posts


