This website uses Cookies. Click Accept to agree to our website's cookie use as described in our Privacy Policy. Click Preferences to customize your cookie settings.
Alerting
Questions about alerting and problem detection in Dynatrace.
Turn on suggestions
Auto-suggest helps you quickly narrow down your search results by suggesting possible matches as you type.
- Dynatrace Community
- Ask
- Alerting
- Re: Not able to see issue in problem notification of OneAgent in default configuration
Options
- Subscribe to RSS Feed
- Mark Topic as New
- Mark Topic as Read
- Pin this Topic for Current User
- Printer Friendly Page
Not able to see issue in problem notification of OneAgent in default configuration
Options
- Mark as New
- Subscribe to RSS Feed
- Permalink
06 Sep 2018
11:30 AM
- last edited on
09 Dec 2021
02:22 PM
by
![]() MaciejNeumann
MaciejNeumann
Hi ,
We are using Dynatrace OneAgent with default configuration to monitor one of the .Net application.
We have been informed from our client that they are experiencing a high response time in loading the page as observed in the user session of the OneAgent.
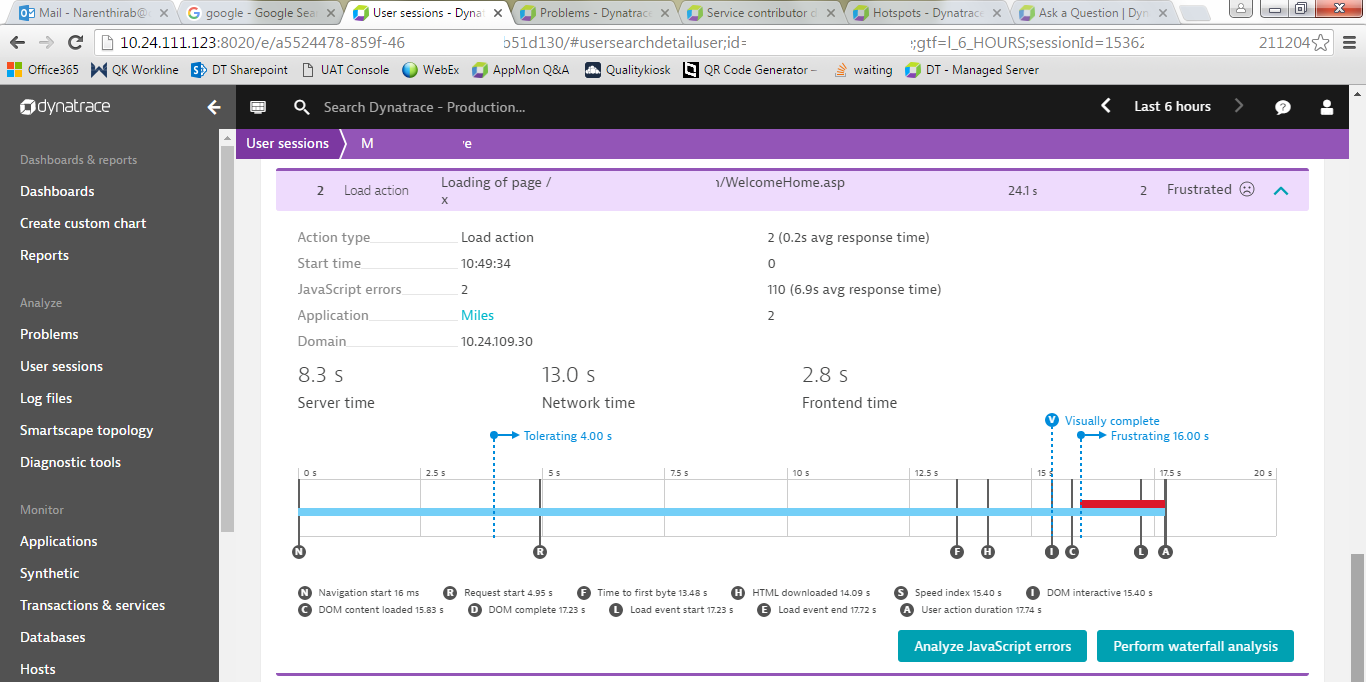
But we not able to see any issue in problem notification of OneAgent in default configuration.
Kindly help.
Regards
Balaji
Labels:
- Labels:
-
dotnet
-
problem detection
-
problems classic
3 REPLIES 3
Options
- Mark as New
- Subscribe to RSS Feed
- Permalink
06 Sep 2018 10:00 PM
Perhaps the average value for this page load is not outside the baseline. Perhaps there is no baseline yet as they just started monitoring the app.
You can always set an explicit threshold, however I would focus on resolving why it does not create a problem ticket. Are the above ideas possible explainations? What is the historical value of this load page?
Options
- Mark as New
- Subscribe to RSS Feed
- Permalink
10 Sep 2018 09:02 AM
Hi Joseph,
We had configured OneAgent 3 days before we experience high response time.
Is there any minimum time-duration for OneAgent to set the baseline ?
Regards
Balaji
Options
- Mark as New
- Subscribe to RSS Feed
- Permalink
10 Sep 2018 12:11 PM
How does the percentage of requests with high response time look like? Are there only few requests with high reponse time?
Certified Dynatrace Master | Alanata a.s., Slovakia, Dynatrace Master Partner
