- Dynatrace Community
- Ask
- Alerting
- Re: Number of red problems differs between Problems page and TimeRangeSelector
- Subscribe to RSS Feed
- Mark Topic as New
- Mark Topic as Read
- Pin this Topic for Current User
- Printer Friendly Page
- Mark as New
- Subscribe to RSS Feed
- Permalink
09 Apr 2019
09:53 AM
- last edited on
17 May 2021
12:03 PM
by
![]() MaciejNeumann
MaciejNeumann
Hello
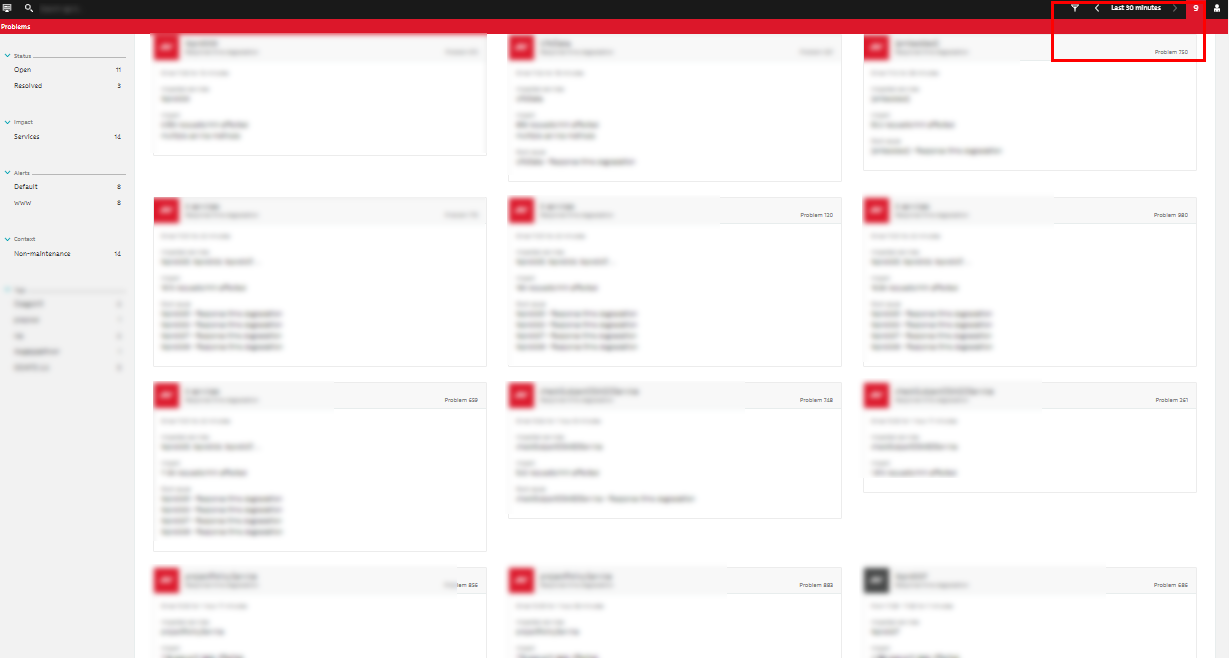
What can it mean if number of red problems differs between [Problems page] and [TimeRangeSelector]
Doc says
Also, note the alerts indicator in the menu bar. In this example, the alerts indicator shows that 2 problem alerts were sent out during the selected timeframe.
But it does not explain or behave this way
Here is 11 open problems but [TimeRangeSelector] shows 9 for long time for whatever time range i select. Curently last 30 min selected:

Regards,
Igor
Solved! Go to Solution.
- Labels:
-
gui
-
problem notifications
-
problems classic
- Mark as New
- Subscribe to RSS Feed
- Permalink
09 Apr 2019 10:44 AM
it may be because the other 2 monitors are in maintenance mode...
- Mark as New
- Subscribe to RSS Feed
- Permalink
09 Apr 2019 11:13 AM
Hello Kulwinder! Can you please explain in more details. We have not set any maintanance periods or simular. I dont understand your hint "2 monitors are in maintenance mode".
- Mark as New
- Subscribe to RSS Feed
- Permalink
09 Apr 2019 10:57 AM
Are you using some kind of filter or management zone filter in the top section of the screen? In general the total open count should be same as you see in the problem feed. The alert indicator on top is a different story, as it is user specific. The top indicator is confusing and we will change its behaviour soon to show the count for 'your users' management zone open problem count instead.
- Mark as New
- Subscribe to RSS Feed
- Permalink
09 Apr 2019 11:09 AM
Hello Wolfgang!
No filters or zones and this is admin user view. If zone selected then its name is presented near or instead of funnel symbol.
As far as i get docs "top indicator" must show "problem alerts were sent out during the selected timeframe" but it does not.
Is it support case candidate?
Regards, Igor
- Mark as New
- Subscribe to RSS Feed
- Permalink
09 Apr 2019 12:12 PM
No, the top indicator shows your personal alerts that were sent out to your mobile app. As I said that is confusing and we will change that in the future.
The sidebar 'Alert' filters show which problems were sent out into all the individual AlertigProfiles you have configured. Different alert channels have different AlertingProfile filters set.
- Mark as New
- Subscribe to RSS Feed
- Permalink
25 Feb 2020 09:33 PM
Hi @Wolfgang B.
Any update about the behavior of the problem indicator? explanation with in the documentation is still the same and still there are sometimes gap between this number and the shown open problems, also there is no change of this number in the indicator when sliding the time.
We can see that the indicator is being update every few seconds with status request that is sent which return the number of open problems, that is not the "right" number.

Please advice how to explain this number.
Also is seem that problem dashboard is not auto refreshing it self, is that a bug or a feature?
Yos
Featured Posts
