This website uses Cookies. Click Accept to agree to our website's cookie use as described in our Privacy Policy. Click Preferences to customize your cookie settings.
Alerting
Questions about alerting and problem detection in Dynatrace.
Turn on suggestions
Auto-suggest helps you quickly narrow down your search results by suggesting possible matches as you type.
- Community Home
- Platform
- Alerting
- Problem: TCP connectivity rate for process WebSphere AS xxxx on host xxx has decreased to 0 %
Options
- Subscribe to RSS Feed
- Mark Topic as New
- Mark Topic as Read
- Pin this Topic for Current User
- Printer Friendly Page
Options
- Mark as New
- Subscribe to RSS Feed
- Permalink
22 Feb 2024
07:33 AM
- last edited on
27 Feb 2024
08:44 AM
by
![]() MaciejNeumann
MaciejNeumann
Hello DT Team,
Our JVM is frequently crashing and above problem message was added Dynatrace dash board. Please advise us on this.
Solved! Go to Solution.
Labels:
- Labels:
-
hosts classic
-
network monitoring
5 REPLIES 5
Options
- Mark as New
- Subscribe to RSS Feed
- Permalink
24 Feb 2024 06:27 AM
Hello Paco,
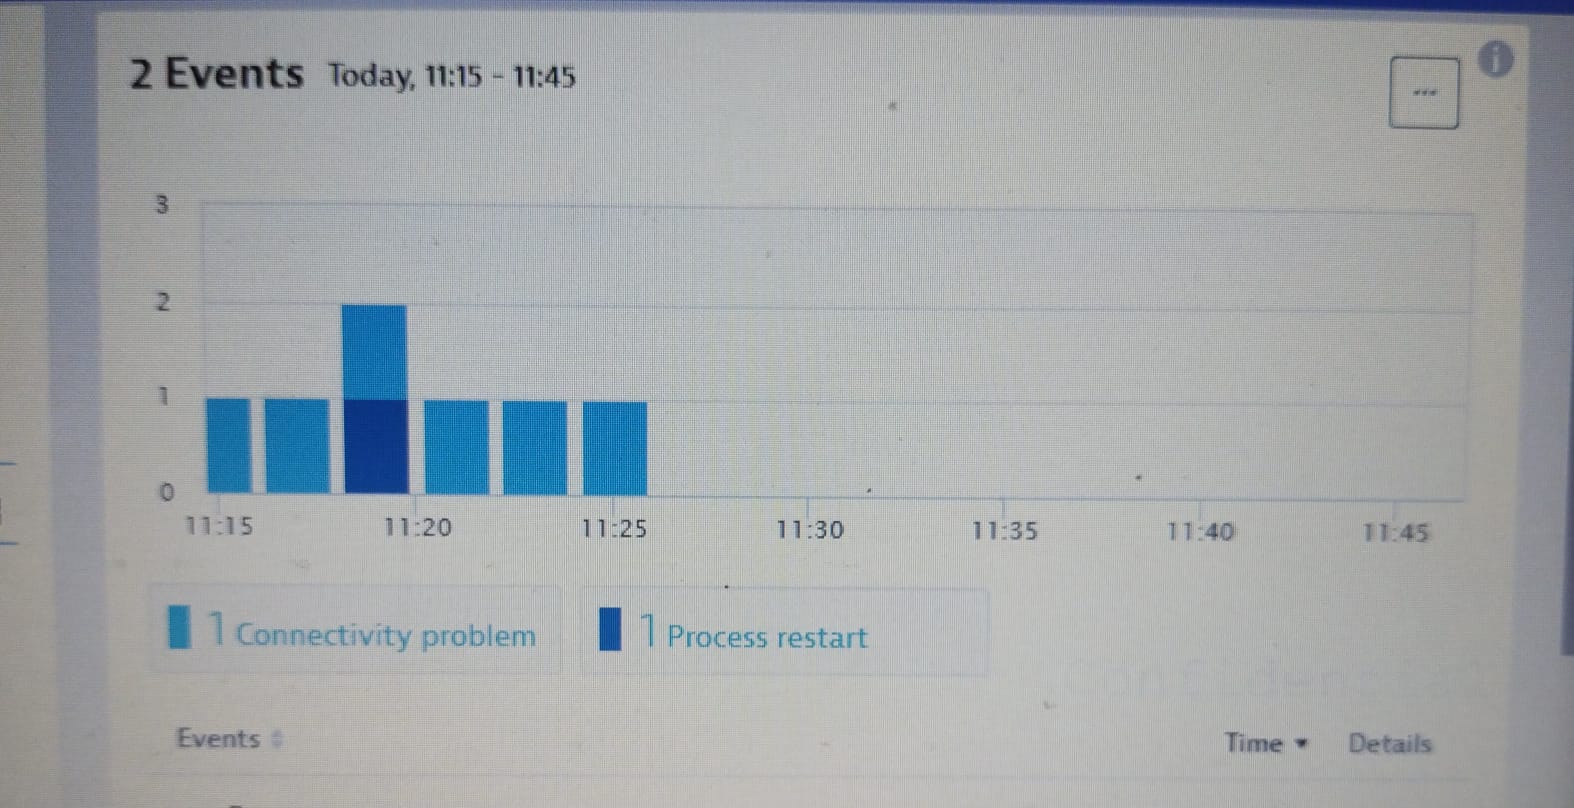
Thanks for your prompt response. JVM is getting crashed frequently and I am getting " TCP connectivity rate for process websphere as xxxx on host xxxx has decreased to 0%:". Find attached screenshot from DT.
DT Alert.jpg
128 KB
Options
- Mark as New
- Subscribe to RSS Feed
- Permalink
26 Feb 2024 08:01 AM
Try using Connectivity alerts

Options
- Mark as New
- Subscribe to RSS Feed
- Permalink
07 Mar 2024 12:02 PM
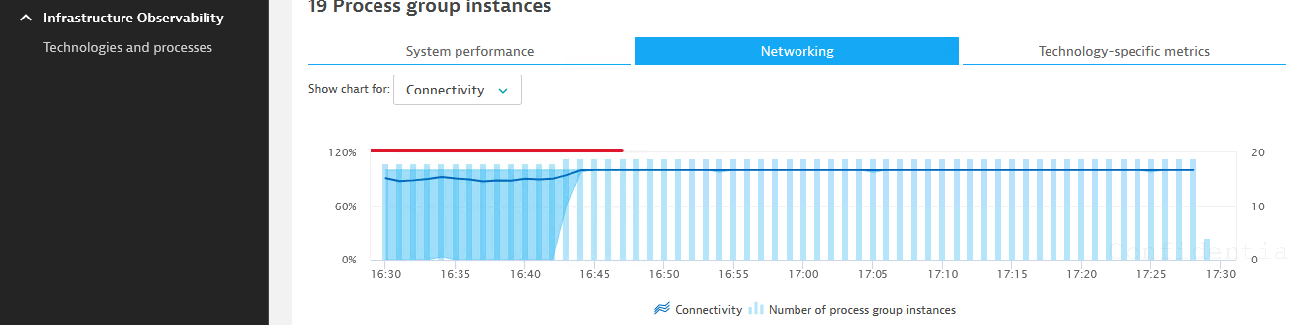
To enable this do I need to have admin access in Dynatrace ? As I am unable to find such option here. Please find the attached screenshot.
Connectivity.PNG
64 KB
Options
- Mark as New
- Subscribe to RSS Feed
- Permalink
24 Feb 2024 12:31 PM
The connectivity problem seems to start before process is restarted. And after it is restarted, it doesn't turn back on, probably because your application is still starting. Connectivity issues can have many causes, but documentation,
https://docs.dynatrace.com/docs/platform-modules/infrastructure-monitoring/networks/how-to-monitor-n...
references some that are the more usual:

Antonio Sousa
Reply
Featured Posts
