- Dynatrace Community
- Ask
- Alerting
- Problem page does not display enough information
- Subscribe to RSS Feed
- Mark Topic as New
- Mark Topic as Read
- Pin this Topic for Current User
- Printer Friendly Page
- Mark as New
- Subscribe to RSS Feed
- Permalink
20 Mar 2019 02:48 PM
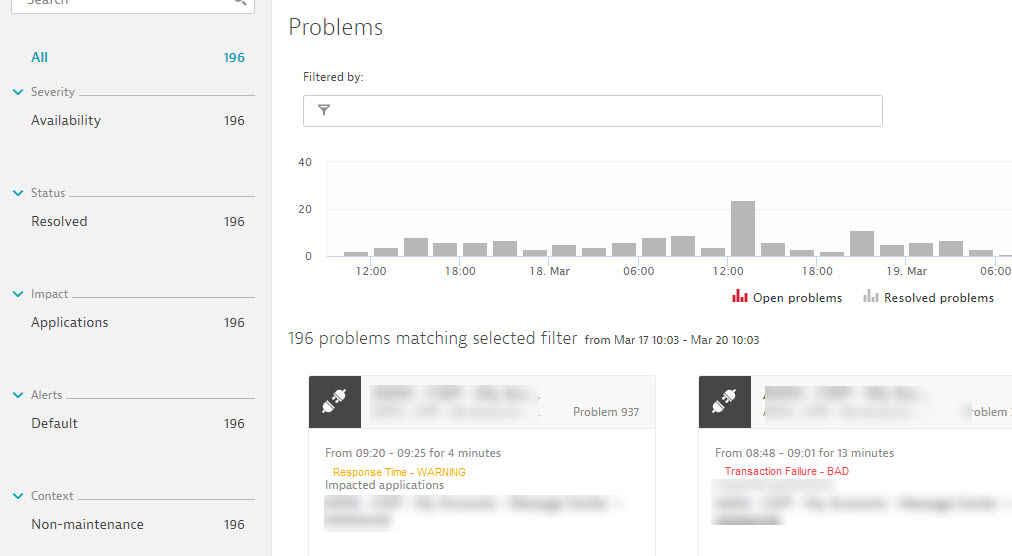
The new problem page needs to detail a bit more info about the current problems. In order to determine if a problem is an initial warning for response, or an all nodes failing 'bad' for transaction, you have to click in to the tile. A one line message would be incredibly helpful
Solved! Go to Solution.
- Labels:
-
dashboards classic
-
problems classic
- Mark as New
- Subscribe to RSS Feed
- Permalink
20 Mar 2019 02:59 PM
Do you mean in the problem feed (list) or in the problem details screen? What kind of information would you expect for a larger problem?
- Mark as New
- Subscribe to RSS Feed
- Permalink
20 Mar 2019 03:17 PM
Here is what I'd like to see happen. If we could provide a list version (like the old portal), that would be helpful to some groups (NOC).

- Mark as New
- Subscribe to RSS Feed
- Permalink
20 Mar 2019 04:31 PM
Severity level filter does that sort of classification already, select 'Slowdown' Severity which would map to your warning Response time class and Severity Error does filter all error related problems. The problem icons also show that type of severity indicator.
- Mark as New
- Subscribe to RSS Feed
- Permalink
20 Mar 2019 04:45 PM
Wolfgang, I am not sure we're on the same page. I don't want to filter. I want to see *all* problems, and be able to see what kind of problems are being raised. This may change as we migrate to being fully on the dashboard, but at present, all I see is the plug&socket icon. No turtles or whatever to indicate slowdown.
- Mark as New
- Subscribe to RSS Feed
- Permalink
21 Mar 2019 07:23 AM
Yes I understand. Slowdowns do have the turtle icon. Availability problems have the plug&socket icon. Maybe your environment does not show any slowdown events at this time. Problems also automatically raise the severity if an error is correlated into the problem, so a slowdown can uplevel to an error or availability problem automatically.
Featured Posts
