- Dynatrace Community
- Ask
- Alerting
- Problem start timestamp is wrong
- Subscribe to RSS Feed
- Mark Topic as New
- Mark Topic as Read
- Pin this Topic for Current User
- Printer Friendly Page
- Mark as New
- Subscribe to RSS Feed
- Permalink
01 Nov 2023 09:33 PM - edited 01 Nov 2023 09:36 PM
Hi all
I noticed that when a problem is opened in dynatrace it will show as it was open before and it is very confusing.
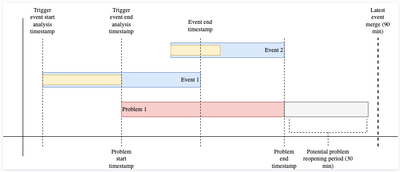
I think that the cause of it is that dynatrace is using the problem start timestamp of the “Trigger event start analysis timestamp” while it should get the “Problem start timestamp” which is the “Trigger event end analysis timestamp”.
you can take a look here:
it is from this documantaion about problems life cycle - https://docs.dynatrace.com/docs/platform/davis-ai/problem-and-root-cause/problem-lifecycle
if this is indeed the case than I think it should be changed .
the problem start time should be the "Problem start timestamp" and not the event start time.
what do you think?
Solved! Go to Solution.
- Mark as New
- Subscribe to RSS Feed
- Permalink
02 Nov 2023 07:32 AM
I think this diagram is a little bit misleading. Dynatrace will create a problem at the problem analysis end timestamp, but with the problem start time then the initial event was received. Typically root cause analysis is 3 minutes, so if your event is received at 8:02, a problem will be created around 8:05 with the timestamp 8:02. This is mostly due to the root cause analysis trying to find other events being part of the same problem.
- Mark as New
- Subscribe to RSS Feed
- Permalink
02 Nov 2023 09:03 AM
Hi
I found problems where it is taking more than 3 minutes analysis but either way I don't think that using the event time is the right thing.
Think of a NOC engineer which is being measured by his response time and he is getting the problems with the event start time so he is "late" with his response time.
It should be at least part of the problems attributes in a way we can choose what should be displayed.
It is misleading the way it is working now.
- Mark as New
- Subscribe to RSS Feed
- Permalink
16 Nov 2023 10:32 AM
Hi @omer_k
Its look like a good product idea
Yos
- Mark as New
- Subscribe to RSS Feed
- Permalink
02 Nov 2023 08:09 AM - edited 02 Nov 2023 08:09 AM
If your Dynatrace Managed environment extremely high (~30 nodes there will be +1 additional minute (8:02 -> 8.06) for internal processing between nodes\network lag.
Regards,
Alex Romanenkov
- Mark as New
- Subscribe to RSS Feed
- Permalink
02 Nov 2023 09:04 AM
Thanks but I am using Saas
Featured Posts

