This website uses Cookies. Click Accept to agree to our website's cookie use as described in our Privacy Policy. Click Preferences to customize your cookie settings.
Alerting
Questions about alerting and problem detection in Dynatrace.
Turn on suggestions
Auto-suggest helps you quickly narrow down your search results by suggesting possible matches as you type.
- Community Home
- Platform
- Alerting
- Process Memory Usage - no time series data found
Options
- Subscribe to RSS Feed
- Mark Topic as New
- Mark Topic as Read
- Pin this Topic for Current User
- Printer Friendly Page
Options
- Mark as New
- Subscribe to RSS Feed
- Permalink
02 Sep 2020 11:16 AM
Hi all,
We received a request, to create a custom alert for a process, when the memory consumption of the process consumes X GB of memory.
I found the closest metric is Technologies > Generic > Memory > Usage .
When I select this, I get the following warning:
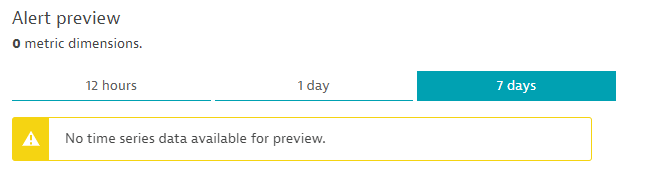
So, there are no metric dimensions, and no time series data is available.
Is there any way to enable this, or am I looking at a wrong metric?
Thanks in advance and best regards,
Balázs
Solved! Go to Solution.
Labels:
- Labels:
-
problems classic
Reply
5 REPLIES 5
Options
- Mark as New
- Subscribe to RSS Feed
- Permalink
02 Sep 2020 12:15 PM
You are looking at the wrong metric, what technology is the process?
You can find the memory metrics in the category for the specific technology e.g.:
- Technologies -> Java virtual machine -> Memory
- Technologies -> Go -> Memory
- Technologies -> Node.js -> Heap
- ....
Dynatrace Certified Master - Dynatrace Partner - 360Performance.net
Options
- Mark as New
- Subscribe to RSS Feed
- Permalink
03 Sep 2020 10:01 AM
Hi,
Thanks for the answers!
This is a .NET application, if I check any of the four memory consumption metrics (HOP, Gen 0 Gen 1, Gen 2) I get the same result, no time series data is available.
Is there any way to enable those?
Options
- Mark as New
- Subscribe to RSS Feed
- Permalink
04 Sep 2020 10:39 AM
They are enabled by default. Do you see data in the process dashboard for that specific process?
Have you restarted the process after installing the OneAgent?
Dynatrace Certified Master - Dynatrace Partner - 360Performance.net
Options
- Mark as New
- Subscribe to RSS Feed
- Permalink
03 Sep 2020 12:17 AM
There is a generic process memory metric at Technologies > Generic > Memory > Process memory usage
Options
- Mark as New
- Subscribe to RSS Feed
- Permalink
03 Sep 2020 10:02 AM
Hi,
Thanks for your answer. The base issue is that this option returns a no time series data available result.
Featured Posts
