- Dynatrace Community
- Ask
- Alerting
- Re: The start time of the problem
- Subscribe to RSS Feed
- Mark Topic as New
- Mark Topic as Read
- Pin this Topic for Current User
- Printer Friendly Page
- Mark as New
- Subscribe to RSS Feed
- Permalink
29 Sep 2021
11:44 AM
- last edited on
29 Sep 2021
11:46 AM
by
![]() MaciejNeumann
MaciejNeumann
Hi all,
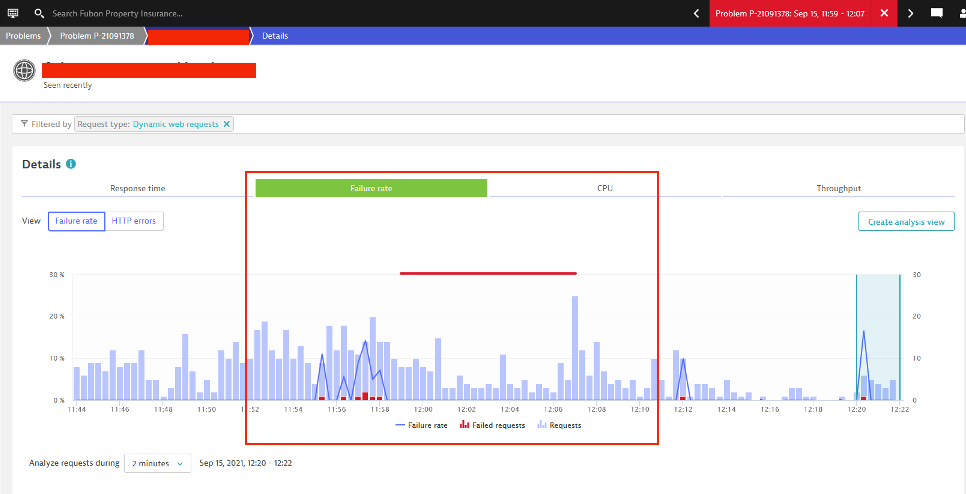
I recently encountered a strange phenomenon when viewing a Problem. From the figure below, we can see that there was no "error request" in the area where the problem was reported. Instead, there was an abnormal error rate before that.
I don't know why the time of this problem starts at 11:59 instead of 11:56. Just imagine, if this is a series of errors, I might come to different conclusions because of the problem time error.
On this point, I don’t know what you think? Is there room for improvement?
Solved! Go to Solution.
- Labels:
-
problem detection
-
problems classic
- Mark as New
- Subscribe to RSS Feed
- Permalink
29 Sep 2021 05:33 PM
Hi Owen
Did you check the value of 'Alert if the service stays in abnormal state for at least ... minutes.' in 'Settings->Anomaly detection->Services'? Maybe this can explain the behaviour.
- Mark as New
- Subscribe to RSS Feed
- Permalink
30 Sep 2021 09:21 AM
Hi Owen,
Are you running on SaaS or managed? if Managed there was a bug that was referred to a lot in these forums. Should have been fixed in 226 to my understanding (at least based on what I saw with my customers).
- Mark as New
- Subscribe to RSS Feed
- Permalink
05 Oct 2021 06:52 AM
Hi gigi,
The dynatrace is running on managed.
Can you provide me with links or "keywords" about the bug you mentioned?
Thank you,
Owen
- Mark as New
- Subscribe to RSS Feed
- Permalink
05 Oct 2021 06:57 AM
Hi Owen,
I can only tell this from correspondance with Support. You may have seen in the forums several posts saying that the time displayed is marked later than the beginning of the problem. To me it seems (looking at 226) that it has indeed been fixed.
If not, I suggest you'll open a support ticket for that.
Gil.
Featured Posts

