- Dynatrace Community
- Ask
- Alerting
- Re: Unable to find anomaly-detection-metrics REST API or documentation?
- Subscribe to RSS Feed
- Mark Topic as New
- Mark Topic as Read
- Pin this Topic for Current User
- Printer Friendly Page
- Mark as New
- Subscribe to RSS Feed
- Permalink
06 Apr 2021
01:58 PM
- last edited on
11 May 2021
12:09 PM
by
![]() MaciejNeumann
MaciejNeumann
{
    "aggregationType": "AVG",
    "alertCondition": "ABOVE",
    "dealertingSamples": 5,
    "description": "The .NET GC time of {severity} is {alert_condition} the threshold of {threshold}",
    "disabledReason": "NONE",
    "enabled": false,
    "eventType": "PERFORMANCE",
    "metricId": "builtin:tech.dotnet.perfmon.%TimeInGC",
    "monitoringStrategy": {
        "alertCondition": "ABOVE",
        "alertingOnMissingData": false,
        "dealertingSamples": 5,
        "samples": 5,
        "threshold": 0,
        "type": "STATIC_THRESHOLD",
        "unit": "PERCENT",
        "violatingSamples": 3
    },
    "name": "{{.name}}",
    "samples": 5,
    "severity": "PERFORMANCE",
    "threshold": 0,
    "unit": "PERCENT",
    "violatingSamples": 3,
    "warningReason": "NONE"
}
Solved! Go to Solution.
- Mark as New
- Subscribe to RSS Feed
- Permalink
12 Apr 2021 08:58 AM
Hi naveen,
This API has the definitions of all custom events for alerting in Dynatrace. These could be alerting events that were deployed as part of extensions (whether built-in or custom) or that were created from the settings page.
The documentation for the API can be found at this link.
You can actually explore these entries in the UI too, in the following places:
- Settings > Anomaly Detection > Custom events for alerting
- Shows all custom created alerts
- Settings > Anomaly Detection > Extension events
- Shows all alerts coming from deployed extensions - both the Dynatrace built-in ones and any custom extensions
- Shows all alerts coming from deployed extensions - both the Dynatrace built-in ones and any custom extensions
Best regards,
Radu
- Mark as New
- Subscribe to RSS Feed
- Permalink
14 Apr 2021 08:08 AM
Hello @nakb
Adding to what @Radu mentioned you can get these details from Dynatrace REST API.
- Generate Token from Settings--> Integration --> Dynatrace API --> Generate Token for Dynatrace Environment API v2 and assign scope.
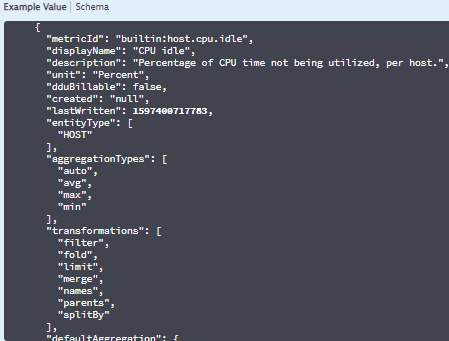
- Post token generation go to Dynatrace Environment API v2 and Authorize the token. Then select "Metrics". Under Metrics you will see below example output which may help you to further dig into it.
Cheers!
R
- Mark as New
- Subscribe to RSS Feed
- Permalink
28 Apr 2021 09:48 AM
Hi Thanks for the information.
Featured Posts


