- Dynatrace Community
- Ask
- Automations
- Re: micrometer metrics with dynatrace not showing on Dynatrace
- Subscribe to RSS Feed
- Mark Topic as New
- Mark Topic as Read
- Pin this Topic for Current User
- Printer Friendly Page
- Mark as New
- Subscribe to RSS Feed
- Permalink
08 Mar 2022
11:18 PM
- last edited on
30 Mar 2022
12:49 PM
by
![]() MaciejNeumann
MaciejNeumann
Hi all,
Im wokring on integrating micrometer with dynatrace minoring for app metrics, I see some metrics from mcirometer registry.(simple registry). im facing some issue while getting the data to Dyna UI.
see that the API returned 202 when called api/metrics/ingest 9v2) api.api logs for the same exporter v2 is missing from app logs. how do I go about troubleshooting this ? would appreciate the help..
this is the config used for app:
management.metrics.export.dynatrace:
  # Required only if not using the OneAgent endpoint
  # For SaaS: https://{your-environment-id}.live.dynatrace.com/api/v2/metrics/ingest
  # For managed deployments: https://{your-domain}/e/{your-environment-id}/api/v2/metrics/ingest
  uri: <URI>

  # should be read from a secure source
  api-token: <API-Token>

  # These properties can only be used with the v2 exporter.
  v2:
    # Sets a prefix that is prepended to each exported metric key.
    metric-key-prefix: scmtesting1

    # If set to true and a local OneAgent or operator is running, retrieves metadata
    # and adds it as additional dimensions to all data points (default: true)
    enrich-with-dynatrace-metadata: true

    # Sets an arbitrary number of key-value pairs as default dimensions.
    # Micrometer tags will overwrite these dimensions, if they have the same key.
    # Each exported metric will contain these dimensions.
    default-dimensions:
      stack: "anscdev2"

    # The export interval in which metrics are sent to Dynatrace (default: 60s).
    step: 60s
thanks,
Krithika S
Solved! Go to Solution.
- Labels:
-
integrations
-
metrics
- Mark as New
- Subscribe to RSS Feed
- Permalink
09 Mar 2022 10:04 AM - edited 09 Mar 2022 10:10 AM
Hello Krithika!
are you trying to export Micrometer metrics to Dynatrace? you mention you see some metrics - where do you see them? are you missing any?
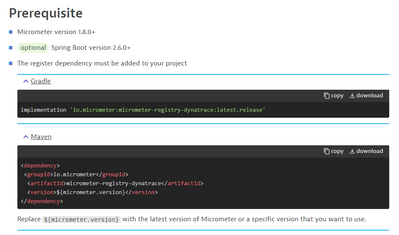
in case you are not seeing any metrics in Dynatrace, you could check if you have included the Gradle or maven decencies in your application:
From the documentation: https://www.dynatrace.com/support/help/how-to-use-dynatrace/metrics/metric-ingestion/ingestion-metho...
This integration is only for exporting metrics. Are you looking into exporting logs to Dynatrace as well?
Feel free to share more details about what you are trying to achieve.
Sonja
P.S: for security purposes, I have removed the URL and token from the configuration file. They both looked ok to me.
- Mark as New
- Subscribe to RSS Feed
- Permalink
09 Mar 2022 03:24 PM
Hi, Gm.
yes im exporting micrometer metric to dynatrace .yes I have dependency to latest 1.8.3 in my app.metrics are exported with registry. but I dont see the logging of any api error or reply in app logs. it remains silent. Nor does it appear in dyna UI , so its not exported as of now. how could I go about troubleshooting this..
- Mark as New
- Subscribe to RSS Feed
- Permalink
09 Mar 2022 05:11 PM
im mostly trying to achieve the metrics integration only not for logs for now. the logs I spoke where from the app side logs for debugging purposes.
- Mark as New
- Subscribe to RSS Feed
- Permalink
10 Mar 2022
10:36 AM
- last edited on
11 Mar 2022
05:23 PM
by
![]() armin_ruech
armin_ruech
Have you already tried to change the log level (see https://www.dynatrace.com/support/help/shortlink/micrometer-metrics-ingest#troubleshooting-with-logs)
logging.level.io.micrometer.dynatrace: DEBUG
If you have tried and are not getting any additional information, I would recommend opening a support ticket for our team to have a closer look.
Sonja
- Mark as New
- Subscribe to RSS Feed
- Permalink
10 Mar 2022 11:37 PM
ok sure. I did.
jdbc.connections.active,dt.metrics.source=micrometer,dt.entity.process_group_instance=PROCESS_GROUP_INSTANCE-F7386E06F851A856,name=directory,dt.entity.host=HOST-656FD45094DD7463 gauge,0.0 1646953620009
jvm.memory.max,area=heap,dt.metrics.source=micrometer,dt.entity.process_group_instance=PROCESS_GROUP_INSTANCE-F7386E06F851A856,id=G1\ Old\ Gen,dt.entity.host=HOST-656FD45094DD7463 gauge,8.05306368E8 1646953620009
system.cpu.count,dt.metrics.source=micrometer,dt.entity.process_group_instance=PROCESS_GROUP_INSTANCE-F7386E06F851A856,dt.entity.host=HOST-656FD45094DD7463 gauge,32.0 1646953620009
http.server.requests,exception=None,method=GET,dt.metrics.source=micrometer,dt.entity.process_group_instance=PROCESS_GROUP_INSTANCE-F7386E06F851A856,uri=/persistence/directory/listReviewTypeCodeGroups,outcome=SUCCESS,status=200,dt.entity.host=HOST-656FD45094DD7463 gauge,min=204.459227,max=204.459227,sum=204.459227,count=1 1646953620010
jdbc.connections.idle,dt.metrics.source=micrometer,dt.entity.process_group_instance=PROCESS_GROUP_INSTANCE-F7386E06F851A856,name=community,dt.entity.host=HOST-656FD45094DD7463 gauge,1.0 1646953620010
hikaricp.connections,dt.metrics.source=micrometer,dt.entity.process_group_instance=PROCESS_GROUP_INSTANCE-F7386E06F851A856,pool=HANA_BUYER2,dt.entity.host=HOST-656FD45094DD7463 gauge,1.0 1646953620010
now I dont see my custom metrics to the logs only system metrics are coming up. so how should I publish the custom micro meter metric to dynaexporter v2 ? are you guys doing it automatically or need I do something.. with statsd to dynatrace ?
- Mark as New
- Subscribe to RSS Feed
- Permalink
11 Mar 2022 10:35 PM
Hi all,
thanks for helping me triage the work on Dynatrace integration. I was able to integrate with debug logs to see where the registry mismatch was there. actually for prod system I had to use dynatrace meter registry and not simple meter registry which does the job.. thanks.
- Mark as New
- Subscribe to RSS Feed
- Permalink
14 Mar 2022 06:57 AM
great news! thanks for letting me know you were able to find the issue.
- Mark as New
- Subscribe to RSS Feed
- Permalink
04 May 2026 04:49 PM
Hi @sonja , i am exporting Dynatrace metrics in a similar way, but facing an issue while querying the count over a period of time for a metric of type Timer, which is exported as a gauge by micrometer-dynatrace-registry.
It will be of great help, if you can look into the following ticket -
https://community.dynatrace.com/t5/Open-Q-A/Unable-to-query-on-a-micrometer-timer-metric-with-respec...
Featured Posts

