- Dynatrace Community
- Ask
- Container platforms
- About Kubernetes Pod metric Inquiries
- Subscribe to RSS Feed
- Mark Topic as New
- Mark Topic as Read
- Pin this Topic for Current User
- Printer Friendly Page
- Mark as New
- Subscribe to RSS Feed
- Permalink
08 Nov 2023
09:04 AM
- last edited on
08 Nov 2023
01:28 PM
by
![]() MaciejNeumann
MaciejNeumann
I'm currently working on a Kubernetes monitoring environment using Prometheus and Grafana. I'm finding that the open source tools have some limitations in providing insights into Kubernetes metrics. I'm looking for a SaaS solution to supplement these limitations.
Does your Product have a dashboard that allows me to view pods that have disappeared(= dead = no longer receiving data) in the past?
How do I filter pods or in this monitor pods that are stuck on terminating status. Keep in mind that terminating status is not part of a pod lifecycle. I have done a lot of searching but i have found any solution. Using FAILED_PHASE is not enough. NB in terminating status you will find that the pod is in running state as well as containers.
I'm curious if your company has a feature that allows me to view pods that have disappeared in the past (i.e., dead = no longer receiving data). If so, can you provide me with any detailed documentation about this feature?
Solved! Go to Solution.
- Labels:
-
dashboards
-
kubernetes
- Mark as New
- Subscribe to RSS Feed
- Permalink
08 Nov 2023 04:02 PM - edited 08 Nov 2023 04:02 PM
Hi @jacob12341414,
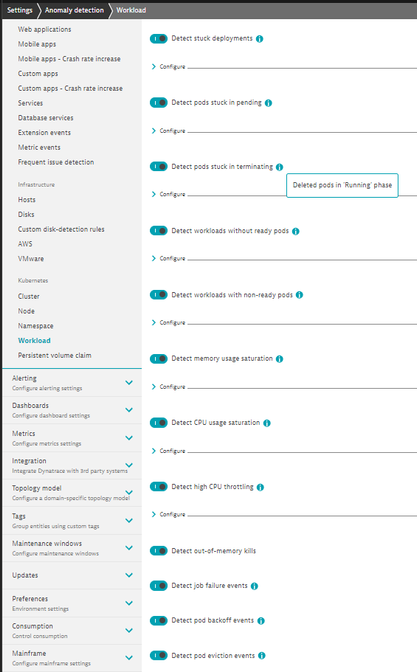
There are many predefined alerts like pos stuck in terminating:
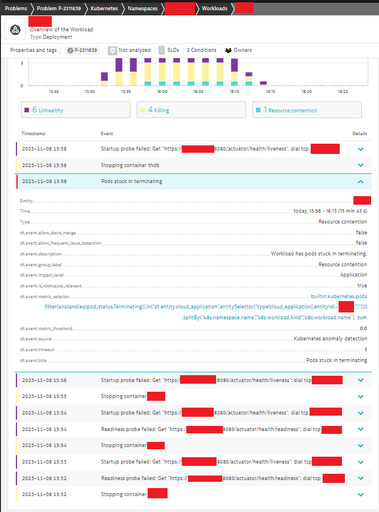
At workload level you can see:
Based on the pod status you can create dashboard tiles eg. for Terminating status. Example for the las 24 hours:
I hope it helps.
Best regards,
Mizső
Featured Posts


