- Dynatrace Community
- Ask
- Container platforms
- How to differentiate Kubernetes metrics collected using OneAgent vs Prometheus in Dynatrace?
- Subscribe to RSS Feed
- Mark Topic as New
- Mark Topic as Read
- Pin this Topic for Current User
- Printer Friendly Page
- Mark as New
- Subscribe to RSS Feed
- Permalink
24 Aug 2022
03:53 PM
- last edited on
25 Aug 2022
08:54 AM
by
![]() Ana_Kuzmenchuk
Ana_Kuzmenchuk
Could someone advise me on how to validate and differentiate the metrics collected by OneAgent and Prometheus from the Kubernetes cluster in Data Explorer in Dynatrace?
Solved! Go to Solution.
- Labels:
-
kubernetes
-
metrics
-
prometheus
- Mark as New
- Subscribe to RSS Feed
- Permalink
25 Aug 2022 01:39 PM
Please help me on my query. I am struck with my POC.
- Mark as New
- Subscribe to RSS Feed
- Permalink
25 Aug 2022 02:14 PM
I try to summarize several recommendations:
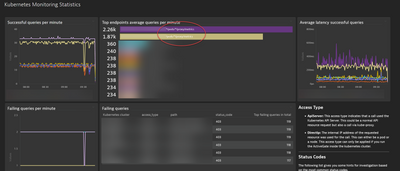
I recommend you to use the Kubernetes Monitoring Statistics Dashboard
You can check there the /metrics scrapping process is working fine. Also have in mind that this integration supports only the counter and gauge Prometheus metric types .
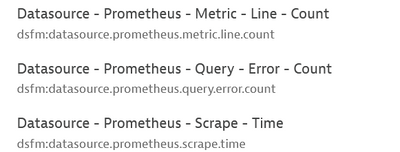
From Data Explorer:
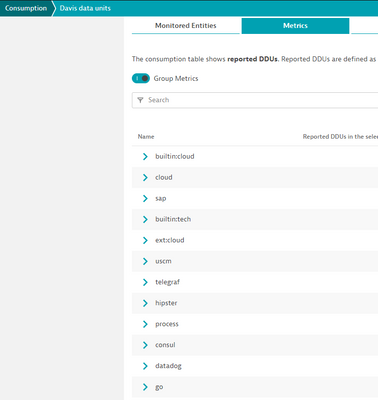
Also in Consumption- Davis data units select Metrics and check the metrics consuming DDU, because OA metrics don't consume DDU's.
Here you can check How to Monitor Prometheus Metrics
- Mark as New
- Subscribe to RSS Feed
- Permalink
07 Sep 2022 08:16 AM
Hi Daniel,
I am using node exporter to scrape the metrics from kubernetes to dynatrace. As suggested I tried to look for the data in data explorer for Prometheus metrics as mentioned in your post . I am not receiving any data.
Hope kubernetes monitoring statistics extension has to deploy in the tenant to get that dashboard. Am I Right? If so I tried to upload the extension in the Dynatrace tenant ->Settings- >custom extension section but unable to do so , receiving error like "Could not connect to the server. try again later".
Please advise.
- Mark as New
- Subscribe to RSS Feed
- Permalink
07 Sep 2022 10:34 AM
Hi SE,
In metrics browser you can check it. metrics are collected by one agent always start with builtin:, other ingested metrics has a different beginning (name), see the consumtion / metrics from demo environment:
I haven't configured prometheus metrics collection form Kubernetes so I do not konow the excat beginning (name) of these kind of metrics.
Br, Mizső
- Mark as New
- Subscribe to RSS Feed
- Permalink
07 Sep 2022 02:10 PM
Any other suggestions how to observe the prometheus metrics in Dynatrace for node exporter in kubernetes. If so how I can differentiate it whether metrics data get collected from oneagent or Prometheus in Dynatrace
- Mark as New
- Subscribe to RSS Feed
- Permalink
28 Mar 2023 01:32 PM
I'd like to refer you to this feedback thread if you have more input.
https://community.dynatrace.com/t5/forums/editpage/board-id/Feedback_channel/message-id/2322
Featured Posts


