- Dynatrace Community
- Ask
- Container platforms
- Re: Java heap memory
- Subscribe to RSS Feed
- Mark Topic as New
- Mark Topic as Read
- Pin this Topic for Current User
- Printer Friendly Page
Java heap memory
- Mark as New
- Subscribe to RSS Feed
- Permalink
24 Feb 2022
03:29 PM
- last edited on
25 Feb 2022
09:49 AM
by
![]() MaciejNeumann
MaciejNeumann
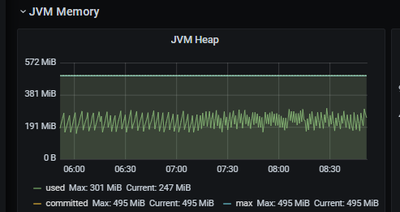
The JVM max heap is set to 512M. The K8s deployment memory is set to 1G for its limit and 1G for its request size. The Grafana (Promethus data) is accurate and reflects the 512 value roughly as expected. Dynatrace on the other hand shows over 688M for heap & 423M used. These are vastly different numbers than what Grafana is showing.
I would like to understand what data DT is showing and why are we seeing such a difference. Eden and Tenured graphs look similar between the two sources.
- Labels:
-
java
-
kubernetes
- Mark as New
- Subscribe to RSS Feed
- Permalink
09 Jan 2023 09:22 PM
Great Question @Vj_K were you able to get an answer or did the metric land within range of each other now?
- Mark as New
- Subscribe to RSS Feed
- Permalink
30 May 2025 11:14 AM
Hey @Vj_K , did you manage to find the solution to your problem? If so, it would be amazing if you've shared it with the rest of the Community! If not, let me know, and I'll look for some further assistance 😊
Featured Posts


