- Dynatrace Community
- Learn
- Product news
- Kubernetes Event Handling - Update 1.278
- Subscribe to RSS Feed
- Mark as New
- Mark as Read
- Printer Friendly Page
Overview
Summary
With Dynatrace version 1.278 some changes in the Kubernetes events handling were done. This post gives an overview of the relevant changes.
What was changed?
Most of the changes were just behind-the-scenes.
If you use Kubernetes events primarily via the standard Kubernetes UI pages (events-card in cluster details page, workload-details page etc. or the new Kubernetes App), the changes only affects you marginally. Worth mentioning here is the change in the event timeout (`dt.davis.timeout`) for unimportant info events. See 'The Changes in Detail / Event Timeouts' section for more information.
If you have used the DT Logs viewer or the Logs API to query and filter Kubernetes events, then this changes fundamentally. This change only applies if the tenant is Dynatrace platform-enabled, i.e. using Grail as the storage system instead of Cassandra / Elastic-Search. In this, and only in this case Kubernetes events are no longer stored as DT log lines. The DQL (Dynatrace Query Language) on Davis events can be used for these queries instead. See 'The Changes in Detail / Event storage' and 'How to Query Kubernetes Events?' section for more information.
If you have used the DT Davis events API or specific event attributes, there is also a notable change. The event context (`event.provider`) of Kubernetes Davis events has been changed from `LOG_MONITORING` to `KUBERNETES_EVENT`. See 'The Changes in Detail / Event Context' section for more information.
Why was it changed?
The changes had several reasons.
Firstly, the previous double storage of Kubernetes events as log-lines and as Davis events was not only confusing but also used twice as much storage resources.
Secondly, the general Davis event context `LOG_MONITORING` that resulted from the automated events extraction mechanism was not very helpful in detecting and filtering Kubernetes events.
Finally, the Davis event timeout on unimportant info events led to too many Davis events being in an `ACTIVE` state, which in some cases led to significant performance disadvantages and the reaching of Davis limits.
When was it changed?
These changes were rolled out with Dynatrace version 1.278.
The Changes in Detail
Event storage
How did it work before 1.278?
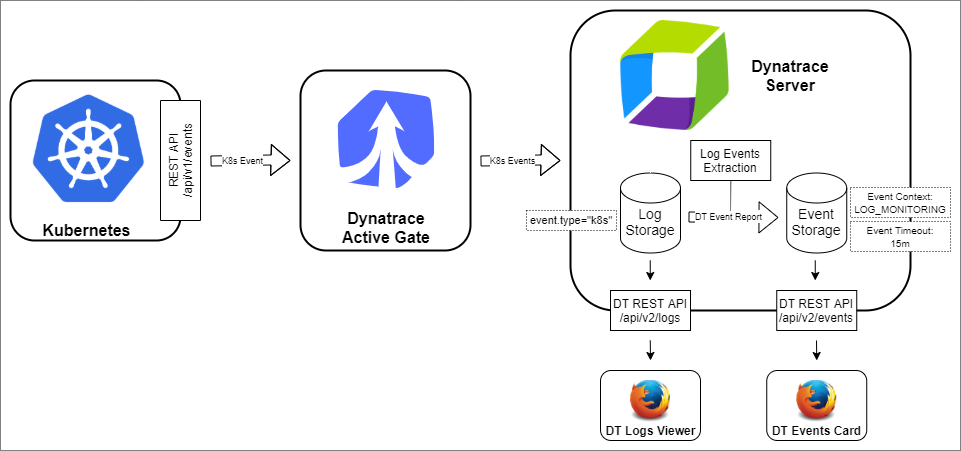
Kubernetes events are retrieved from the Kubernetes server via the Kubernetes events REST API. This is done by the Dynatrace ActiveGate. The ActiveGate is responsible to bundle and forward Kubernetes events to the Dynatrace server. On the DT server, events were stored as DT log lines first. In a second step DT Davis events were created out of these log lines by the automatic Events extraction (Settings: Log monitoring → Events extraction) mechanism. So at the end, Kubernetes events were stored as DT log lines and as Davis events.
When querying Kubernetes events from the log lines, the `event_type=k8s` criteria had to be used.
How does it work now?
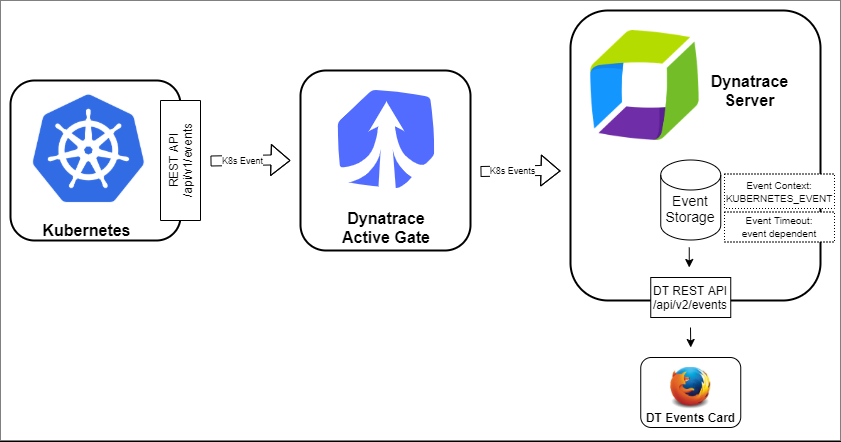
The first step of storing Kubernetes events as log-lines has been removed. Kubernetes events are not stored as log-lines any more and as a result also can not be queried/seen over the log viewer any more.
Exception: If and only if the customer account is not platform-enabled (i.e. Kubernetes Davis events are not stored in Grail) Kubernetes events will continue to be stored as log-lines to make querying easier.
The Kubernetes Davis event creation is no longer done by the automatic Events extraction mechanism. The associated Default Kubernetes Log Events mapping was removed. Kubernetes Davis events are now directly created as injected to Dynatrace.
Event Context (Event Provider)
How did it work before 1.278?
With the usage of the automatic Events extraction mechanism mentioned above, all these Kubernetes Davis events automatically got the event context `LOG_MONITORING`.
How does it work now?
The event context was changed from the general `LOG_MONITORING` value to the specific `KUBERNETES_EVENT` one, which makes the event querying clearer.
Event Timeouts
How did it work before 1.278?
Any Dynatrace Davis event has a timeout. The timeout determines the time after which an event is automatically closed after the last update of the event occurred. This timeout was set to 15 minutes for all Kubernetes Davis events.
How does it work now?
For all Kubernetes Davis root-cause relevant events (more or less all important events), the event timeout is still set to 15 minutes. Also for all Kubernetes event series (events kept open by Kubernetes over a longer period of time, where only the event count is increased when they occur again), the Dynatrace event timeout is also still set to 15 minutes.
For all other not root-cause relevant Kubernetes Davis events, the event timeout is now set to zero minutes (point-in-time event), what means that they are immediately closed and not in an `ACTIVE` (open) state any more. This doesn't have a major impact on the display and use of events, but it does have a positive effect on the performance of the Davis analysis.
Marking of Important Events
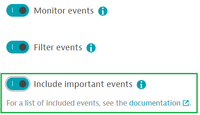
The Kubernetes cluster monitor settings for event filtering have the *Include important events* option. This option ensured that important events such as Kubernetes warning events are taken into account despite the setting of restrictive filters.
See 'Monitor important events' for more details.
To make this important term also visible on the Davis events itself, an additional event attribute `dt.kubernetes.event.important` is now written to each event and can be used for querying.
How to Query Kubernetes Events?
When Customer Account is Platform-Enabled
When the customer account is platform enabled (Davis events are stored in Grail and new Platform UI available), Kubernetes events can be directly queried using DQL. Here the new event context KUBERNETES_EVENT is very helpful to identify Kubernetes events.
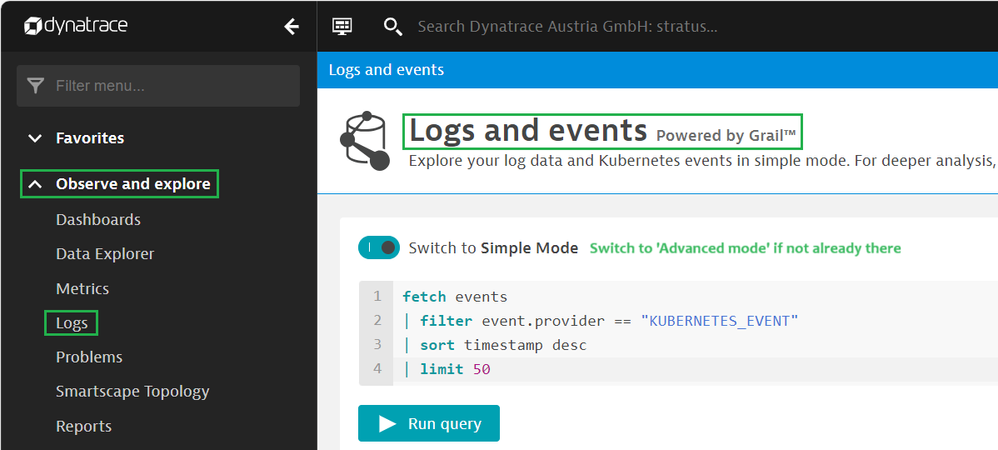
You can query it either in the classic Dynatrace ‘Logs and events Viewer’ in the ‘advanced mode’ or in the new Dynatrace platform UI in a custom notebook or dashboard.
Alternatively, the `dt.kubernetes.events` metric could be used to retrieve statistical data for events.
Example in classic Dynatrace *Logs and events* Viewer
Example DQL query for Kubernetes Davis Events
fetch events
| filter event.provider == "KUBERNETES_EVENT"
| fields timestamp, dt.kubernetes.event.uid, dt.kubernetes.event.reason, dt.kubernetes.event.message, status,
         dt.kubernetes.event.involved_object.kind, dt.kubernetes.event.involved_object.name,
         dt.kubernetes.event.first_seen, dt.kubernetes.event.last_seen, dt.kubernetes.event.count,
         dt.source_entity, dt.entity.kubernetes_cluster, dt.entity.cloud_application_namespace,
         dt.kubernetes.event.important, dt.davis.is_rootcause_relevant, dt.davis.timeout, event.status
| sort timestamp desc
| limit 50
Possible attributes
The following list is not complete, but attempts to list the most important attributes.
| Dynatrace Davis Event Attribute | Kubernetes Event Path (`kubectl explain event`) |
Description |
| `event.provider` | - | Dynatrace Davis event source/provider. For Kubernetes events the value is `KUBERNETES_EVENT`. |
| `timestamp` | - | Timestamp, the event was created/updated in Dynatrace. |
| `dt.kubernetes.event.uid` | `event.metadata.uid` | Kubernetes event object uid. |
| `dt.kubernetes.event.reason` | `event.reason` | Kubernetes event reason. Kind of (machine readable) short form of the message. |
| `dt.kubernetes.event.message` | `event.message` | Kubernetes event message. |
| `status` | `event.type` | Severity of the Kubernetes event: `INFO` (Kubernetes Normal) or `WARN` (Kubernetes Warning). |
| `dt.kubernetes.event.involved_object.kind` | `event.involvedObject.kind` | Kind of the involved Kubernetes object (e.g. `Pod`, `Job` etc.). |
| `dt.kubernetes.event.involved_object.name` | `event.involvedObject.name` | Name of the involved Kubernetes object. |
| `dt.kubernetes.event.first_seen` | `event.firstTimestamp` | Time when the Kubernetes event was first seen by Kubernetes. |
| `dt.kubernetes.event.last_seen` | `event.lastTimestamp` | Time when the Kubernetes event was last seen by Kubernetes. |
| `dt.kubernetes.event.count` | `event.count` | Number of times the Kubernetes event has occurred. |
| `dt.source_entity` | - | Dynatrace entity, the event is related to. |
| `dt.entity.kubernetes_cluster` | - | Dynatrace cluster entity, the event is related to. |
| `dt.entity.cloud_application_namespace` | - | Dynatrace namespace entity, the event is related to. |
| `dt.kubernetes.event.important` | - | Dynatrace marker, whether this event is important or not (see 'Marking of Important Events' mentioned above). |
| `dt.davis.is_rootcause_relevant` | - | Dynatrace Davis event marker, whether this event is relevant for Davis root cause analysis. |
| `dt.davis.timeout` | - | Dynatrace Davis event timeout in minutes (see 'Event Timeouts' mentioned above). |
| `event.status` | - | Dynatrace Davis event status: `ACTIVE`, `CLOSED`. |
When Customer Account is not Platform-Enabled
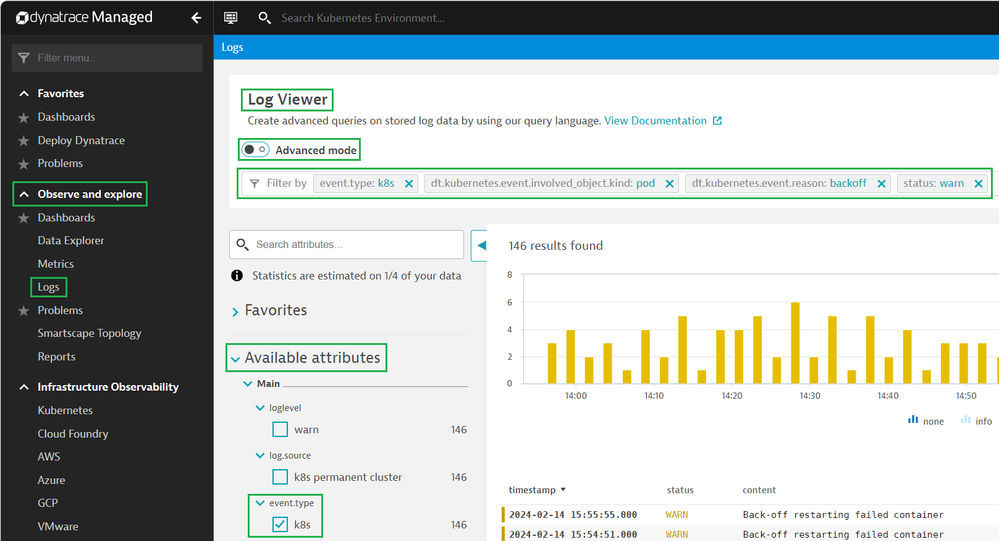
When the customer account is not platform enabled (events not stored in Grail), Kubernetes events can be queried as log-lines in the Dynatrace log viewer.
Alternatively, the `builtin:kubernetes.events` metric could be used to retrieve statistical data for events.
Example querying Kubernetes event log-lines in Dynatrace Log Viewer
Example Log viewer query for Kubernetes Event Log-Lines
event.type="k8s" AND dt.kubernetes.event.involved_object.kind="pod" AND
dt.kubernetes.event.reason="backoff" AND status="warn"
