- Dynatrace Community
- Ask
- Container platforms
- Re: Kubernetes(K8s)- container cpu/memory Utilization in % of limit
- Subscribe to RSS Feed
- Mark Topic as New
- Mark Topic as Read
- Pin this Topic for Current User
- Printer Friendly Page
- Mark as New
- Subscribe to RSS Feed
- Permalink
02 Sep 2022 02:35 PM - last edited on 02 Sep 2022 03:21 PM by Radoslaw_Szulgo
Hi,
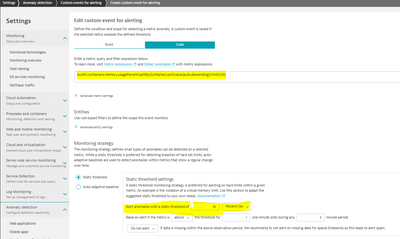
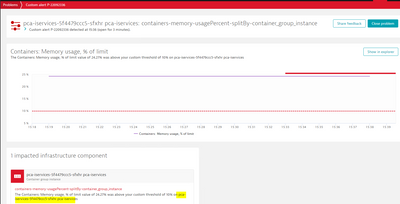
I have created Custom Alert for container CPU and memory utilization in % of the limit.
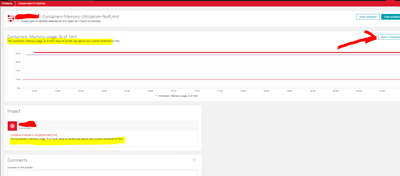
It has triggered problems but in Problem details there is no container/containerGroup name printed,
please let me know whether its possible to print container/containerGroup name in Problems.
Or let me know if there is totally different approach to achieve this.
select "show Explorer" to show containers breaching threshold.
Solved! Go to Solution.
- Labels:
-
dynatrace managed
-
kubernetes
- Mark as New
- Subscribe to RSS Feed
- Permalink
02 Sep 2022 07:51 PM
Hello,
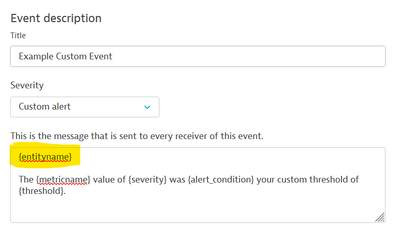
It looks like you may be missing the {entityname} placeholder in your custom event description.
Try something like this:
- Mark as New
- Subscribe to RSS Feed
- Permalink
05 Sep 2022 08:27 AM
Hi Chris- thanks for reply.
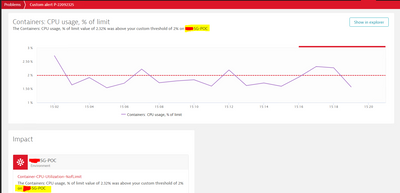
{entityname} -> entityname giving Env name here not container/containerGroup name.
The {metricname} value of {severity} was {alert_condition} your custom threshold of {threshold} on {entityname}
- Mark as New
- Subscribe to RSS Feed
- Permalink
05 Sep 2022 07:27 AM - edited 05 Sep 2022 07:58 AM
Hi 👋,
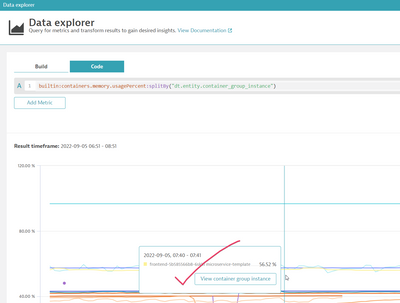
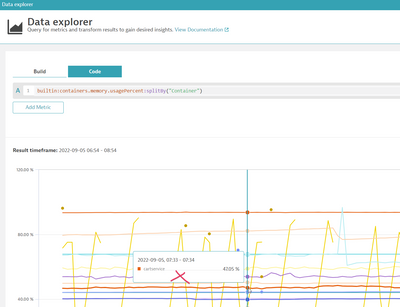
you need to use the "container-group-instance" for splitting. The "Container" is only the name, so it doesn't link to an entity. The container-group-instance is the unique identifier for your container and is thus linked to an entity.
builtin:containers.memory.usagePercent:splitBy("dt.entity.container_group_instance")
Using a valid entity for splitting will result in the proper link in your problem card 🙂
You can always use our data-explorer for testing these links by hovering over some lines.
FYI - here is a collection with some frequently asked expressions for K8s. This also includes my suggestion for your use-case: Checking this on a workload/deployment level instead of every single container. Cause you likely want to know if this is a general problem (e.g., limits set too low), or just some container randomly hitting the limits.
Hope this helps 🙂
- Mark as New
- Subscribe to RSS Feed
- Permalink
05 Sep 2022 08:50 AM
Hi Florian,
thanks for reply.
The approach suggested by you looks good, its showing container-group-instance in the problems.
builtin:containers.memory.usagePercent:splitBy("dt.entity.container_group_instance").
please can someone let me know why such metrics are not given at POD level ?
- Mark as New
- Subscribe to RSS Feed
- Permalink
05 Sep 2022 11:38 AM - edited 05 Sep 2022 11:40 AM
Hi - here you go 🙂
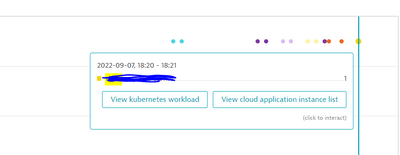
builtin:containers.memory.usagePercent:parents:splitBy("dt.entity.cloud_application_instance"):max
- Mark as New
- Subscribe to RSS Feed
- Permalink
07 Sep 2022 02:01 PM
Hi @florian_g , I am also facing a similar issue where the Problem is not getting tracked under the correct entity and the alert I have created is to notify me when a container restarts on my AKS , I cross checked the alert I have with the sample provided in the github link you shared and it almost looks similar with some extra filters in my case . Below is the metric expression I use :
builtin:kubernetes.container.restarts:filter(and(in("dt.entity.kubernetes_cluster",entitySelector("type(kubernetes_cluster),entityName(~"prod~")")),in("dt.entity.cloud_application_namespace",entitySelector("type(cloud_application_namespace),entityName(~"agys~")")))):splitBy("dt.entity.cloud_application"):sort(value(auto,descending)):limit(100)
- Mark as New
- Subscribe to RSS Feed
- Permalink
08 Sep 2022 11:10 AM - edited 08 Sep 2022 11:10 AM
Hi 👋
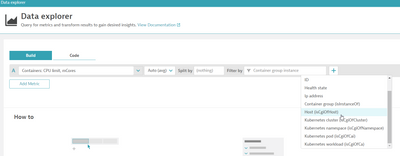
first of all: congratulations on coming up with this entity filter 🚀 great job. As a quick side note, in case you don't know: Our data explorer is of great help here for creating such filters - most of the time I use it for coming up with an initial filter, and later refine it in code mode.
Back to your question - the query looks good to me. So the problem is triggered, but not attached to the right entity? Can you share some screenshots? I would be interested in the problem screen of an active problem and the corresponding alert configuration.
- Mark as New
- Subscribe to RSS Feed
- Permalink
08 Sep 2022 11:20 AM - edited 08 Sep 2022 11:30 AM
Hi ,
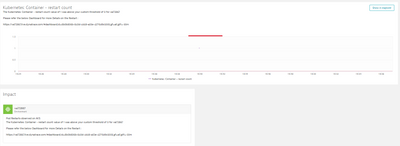
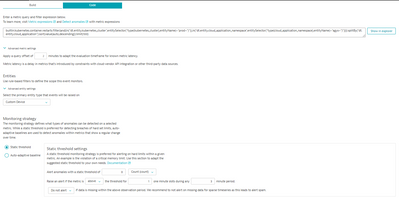
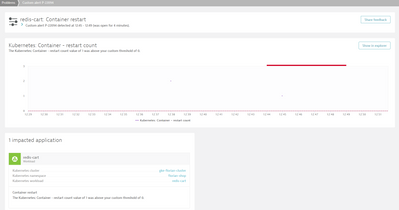
Please find below the screenshot for one of the sample fired alerts , the problem is attaching itself to the Environment , in my case my Env ID is val72867
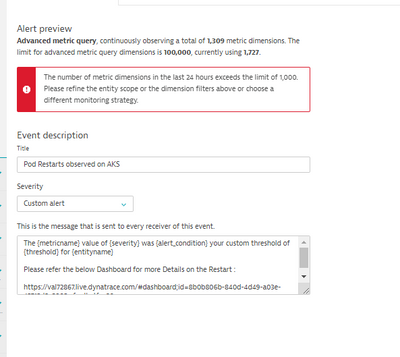
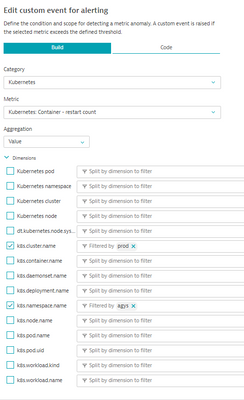
Below is my Alert configuration :
also the "The number of metric dimensions in the last 24 hours exceeds the limit of 1,000. Please refine the entity scope or the dimension filters above or choose a different monitoring strategy" error is something I am seeing only today
- Mark as New
- Subscribe to RSS Feed
- Permalink
08 Sep 2022 11:55 AM
thx - the dimension error is a limitation, meaning there are too many entities in scope of the given filter. can you please also share the upper part of your config?
- Mark as New
- Subscribe to RSS Feed
- Permalink
08 Sep 2022 12:21 PM
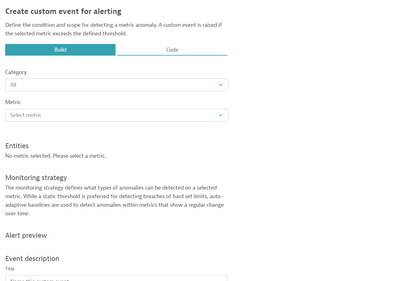
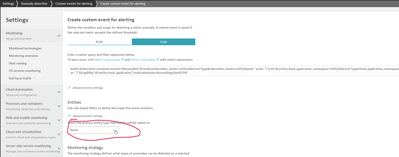
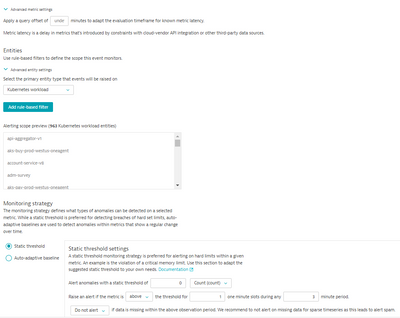
Thanks , Pls find below the requested information
- Mark as New
- Subscribe to RSS Feed
- Permalink
08 Sep 2022 02:06 PM
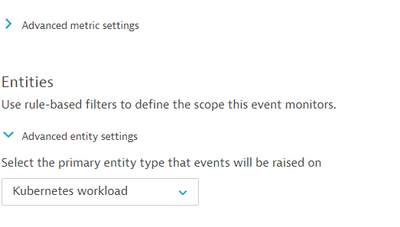
looks like your primary entity is wrong - please try "None" or "Kubernetes workload" in there. this should fix your issue.
- Mark as New
- Subscribe to RSS Feed
- Permalink
08 Sep 2022 03:35 PM
Thanks a ton , I have changed my alert type to Kubernetes workload to if it helps . Will cross check as soon as another alert fires .
Is there some recommendation to get around the "the dimension error is a limitation," issue ? Will this prevent us from getting alerted if there is a issue ? Also please do share any recommendation to avoid such in this case . Below is the query I use .
builtin:kubernetes.container.restarts:filter(and(in("dt.entity.kubernetes_cluster",entitySelector("type(kubernetes_cluster),entityName(~"prod~")")),in("dt.entity.cloud_application_namespace",entitySelector("type(cloud_application_namespace),entityName(~"agys~")")))):splitBy("dt.entity.cloud_application"):sort(value(auto,descending)):limit(100)
Should i avoid using some filters maybe ? I for sure need the namespace filter , but if it helps I can try avoiding the clustername filter .
- Mark as New
- Subscribe to RSS Feed
- Permalink
08 Sep 2022 04:38 PM
Just would like to pass the Thanks to @florian_g , The primary entity type change works great and I see the problem now linking to the correct workload 🙂
- Mark as New
- Subscribe to RSS Feed
- Permalink
09 Sep 2022 11:26 AM
Happy Friday @hari-m94 👋,
as you said, the limitation makes your alert unreliable. Basically, the problem is, that there's simply too much data per minute to keep track off. So actually narrowing down the scope of your alert (that is, adding filters), might help you to solve this. From what I know, there's one limit per alert and one limit for your entire environemnt. Meaning, that you won't be able to simply narrow down the scope of your alert and afterward create an endless number of alerts to cover all the other areas. At some point this limit is likely going to hit you. So that's likely not what you wanted to hear - so let's turn to the good news.
We're currently working on a variety of out-of-the-box alerts for K8s entities which will easily scale also to large environments - enabled by simply flipping a toggle (no metric expression needed 💓). Think of alerts for frequent container restarts, OOM kills, abnormal CPU throttling, namespaces hitting quotas, your k8s cluster running out of CPU/mem, ... you name it 😉 Of course, customizable and easy to only configure for a narrow scope (like you're doing with your filter) or your entire tenant.
We're currently testing internally a first MVP for that and hope to deliver this feature soon. The plan is to provide you with some first alerts during CQ4 this year. The roll-out will afterward happen in phases: We'll start with a smaller set of alerts and will add more with later releases.
Hope you love these great news as much as I do 🙂
Happy weekend 👋
- Mark as New
- Subscribe to RSS Feed
- Permalink
09 Sep 2022 11:52 AM
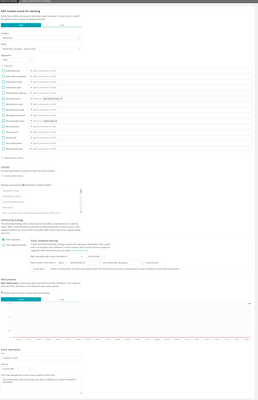
just realized another very important thing @hari-m94 - your use-case only involves one metric. For such use-cases, I always recommend sticking with the "build" mode - this one comes without the mentioned limitations 🚀 See below how this could look like for your use-case - works perfectly in my environment.
- Mark as New
- Subscribe to RSS Feed
- Permalink
16 Sep 2022 12:29 PM
Thanks , I will try out this using the builder and let you know how it goes.
And pretty exited about the Alerting improvements coming our way 🙂
- Mark as New
- Subscribe to RSS Feed
- Permalink
20 Sep 2022 10:47 AM
Hi @florian_g ,
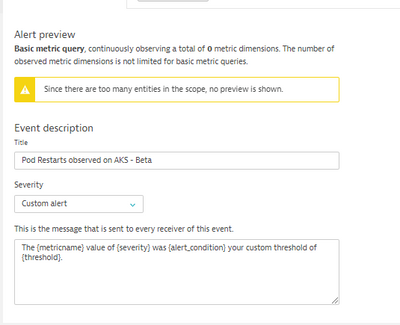
Unfortunately the builder way of adding the alerts is not working as all and I am seeing no alerts getting fired . Unsure if I am missing something . Please take a look and advise (I have added the alert screenshots below for you quick reference)
- Mark as New
- Subscribe to RSS Feed
- Permalink
30 Sep 2022 12:45 PM
looks valid - only thing I notice: the query offset says "undefined" (second screenshot on top). Could you set this to the default of 2 pls?
If this does not help, please open up a support ticket as then I would want to have my support/engineering friends to have a look at it.
Featured Posts
