This website uses Cookies. Click Accept to agree to our website's cookie use as described in our Privacy Policy. Click Preferences to customize your cookie settings.
Container platforms
Questions about Kubernetes, OpenShift, Docker, and more.
Turn on suggestions
Auto-suggest helps you quickly narrow down your search results by suggesting possible matches as you type.
- Community Home
- Platform
- Container platforms
- Re: Kubernetes Monitoring of Cloud application
Options
- Subscribe to RSS Feed
- Mark Topic as New
- Mark Topic as Read
- Pin this Topic for Current User
- Printer Friendly Page
Options
- Mark as New
- Subscribe to RSS Feed
- Permalink
04 Aug 2020
08:26 AM
- last edited on
16 Dec 2021
03:38 PM
by
![]() MaciejNeumann
MaciejNeumann
Hello,
We have followed the latest improvement about monitoring Kubernetes and definitivelly better than it used to be. Thanks 🙂
I have one question about pod/container monitoring. We use PGBouncer to connect to our Postgresql SQL Database.
I can see the pod in cloud application, i can see the CPU and the ram usage. Perfectly fine but can't get any historic data like others containers/pods.
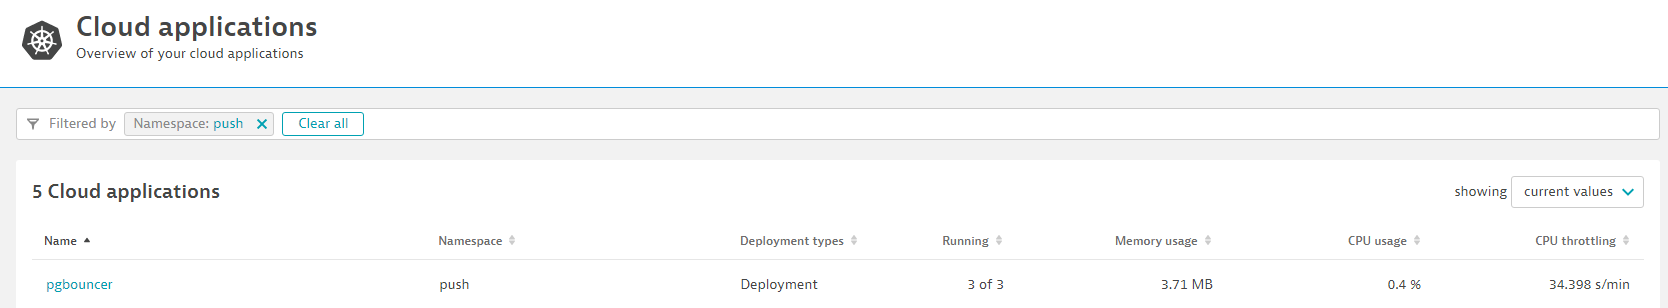
If i click on it I get that :
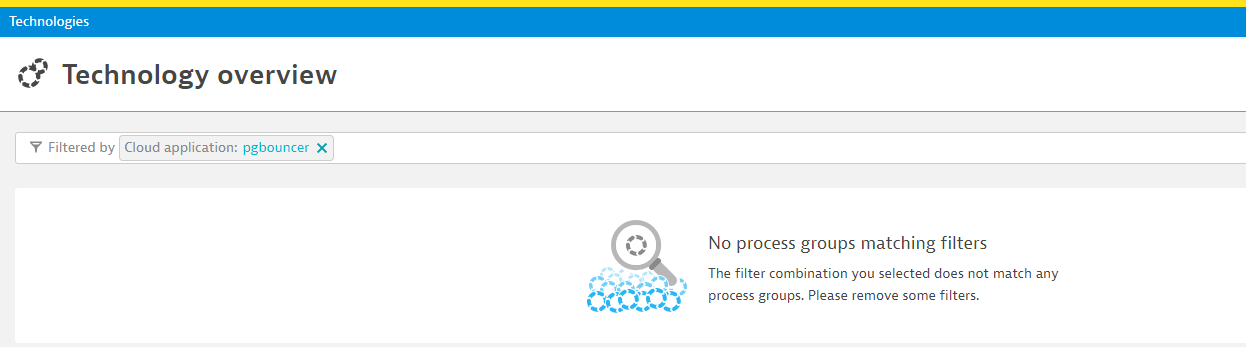
But I am sure you have the historic data (cpu/ram/...) as you displayed them in the first list.
How can I get those historic data ?
Note : We have one agent on all our kubernetes nodes and we are connected with activegate to the Kubernetes API (and we are up to date on both).
Thanks,
Alexandre
Solved! Go to Solution.
Labels:
- Labels:
-
kubernetes
5 REPLIES 5
Options
- Mark as New
- Subscribe to RSS Feed
- Permalink
04 Aug 2020 01:04 PM
So just to confirm, you have the cluster being monitored via the API connection and you have the Oneagent Operator deployed to the Node with has deployed the oneagent to the pods and containers? and these are all up to date?
-Chad
Options
- Mark as New
- Subscribe to RSS Feed
- Permalink
04 Aug 2020 02:34 PM
Exactly ! We deploy the oneagent with Dynatrace Operator and we are all up to date.
For PHP/Nginx Process I can see the metrics without any issue but not pgbouncer. But I don't think PGbouncer is supported in full stack.
But from my understand i should be able to see the CPU usage/Ram usage of this container/pod.
Options
- Mark as New
- Subscribe to RSS Feed
- Permalink
04 Aug 2020 07:48 PM
Thats correct but the containers and pods will be listed under "Hosts" in dynatrace.
-Chad
Options
- Mark as New
- Subscribe to RSS Feed
- Permalink
05 Aug 2020 10:53 AM
So I can see deployment in cloud application and if I click on one deployment, i will see the list of pod inside my container. But is it only true if the pod tehchology is supported by Dynatrace.
So if I sum up :
- the data of cloud applications is coming from kubernetes API (whatever the technology)
- If i click on one deployement in cloud application, the data displayed in "technology overview" come from OneAgent installed in AKS (so need to be supported by Dynatrace)
If i want to see the cpu usage/memory usage/throtthling, i need to go to each node, go to View Container.
=> But with this screen I don't have any historic (only the last 30 minutes !).
Is there any way to have history of cpu/memory/thotthling on the last 7 days for one pod or 1 container ? I though it was in the scope of all the improvement done about Kubernetes but it seems not.
Options
- Mark as New
- Subscribe to RSS Feed
- Permalink
05 Aug 2020 01:09 PM
That is very interesting. I would open a support ticket up as you should be able to see the historical data from since the oneagent has been installed. That current behavior is unintended.
-Chad
Featured Posts
