- Dynatrace Community
- Ask
- Container platforms
- Re: Pods
- Subscribe to RSS Feed
- Mark Topic as New
- Mark Topic as Read
- Pin this Topic for Current User
- Printer Friendly Page
- Mark as New
- Subscribe to RSS Feed
- Permalink
22 Jan 2024
07:24 PM
- last edited on
23 Jan 2024
08:34 AM
by
![]() MaciejNeumann
MaciejNeumann
good afternoon.
Can someone please help me. I need to create a dashboard with metrics of pods that restart quite a bit over a period of time.
Greetings,
Solved! Go to Solution.
- Labels:
-
dashboards
-
kubernetes
- Mark as New
- Subscribe to RSS Feed
- Permalink
22 Jan 2024 08:59 PM
Hi @Ccastrillon,
In Managed:
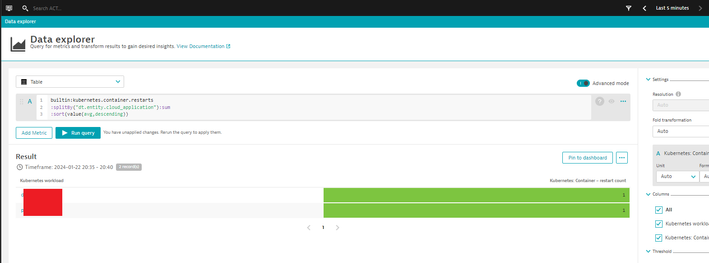
builtin:kubernetes.container.restarts
:splitBy("dt.entity.cloud_application"):sum
:sort(value(avg,descending))
You can create it in data explorer an then pin it to a classic dashboard:
eg. for oom kill I have created a monthly review with time fram selectros: -3M/M to -2M/M, -2M/M to -1M/M, -1M/M to now/M
In Saas I do not know the exact data structure because I do not have to much experience with it but I hope it helps, some fields should be replaced to the proper value (eg. event.name and / or event.provider)
fetch events, scanLimitGBytes:-1, from: -30m
| filter event.provider == "KUBERNETES_EVENT"
| summarize count = count(),by:{event.name, dt.kubernetes.event.involved_object.name}
| filter event.name == "Job completed"
Best regards,
Mizső
- Mark as New
- Subscribe to RSS Feed
- Permalink
23 Jan 2024 12:33 PM
Good morning.
Thank you very much for your reply. I am very grateful to you for helping me.
Best regards,
- Mark as New
- Subscribe to RSS Feed
- Permalink
23 Jan 2024 01:03 PM
Great 🙂
Featured Posts


