- Dynatrace Community
- Ask
- DQL
- DQL - get the top 5 process of each host
- Subscribe to RSS Feed
- Mark Topic as New
- Mark Topic as Read
- Pin this Topic for Current User
- Printer Friendly Page
- Mark as New
- Subscribe to RSS Feed
- Permalink
01 Jun 2023 06:40 PM
Hi,
I am now facing a problem when writing the DQL query to get the top 5 processes of each host in an 1-hour interval.
Here is the DQL that I come up with:
timeseries max(dt.process.cpu.usage),
by:{host.name, dt.process_group_instance},
interval:1h,
from:-2h,
to:now()
| limit 5
But seems like the logic is not correct. If I add "limit 5", it only shows me 5 records in total.
I need the host name and process name in the result.
Grateful if anyone can help on the this issue.
Thanks!
Solved! Go to Solution.
- Labels:
-
dql
- Mark as New
- Subscribe to RSS Feed
- Permalink
02 Jun 2023 08:21 AM
Hi @StephenLHChan ,
this is the query I suggest for your use case:
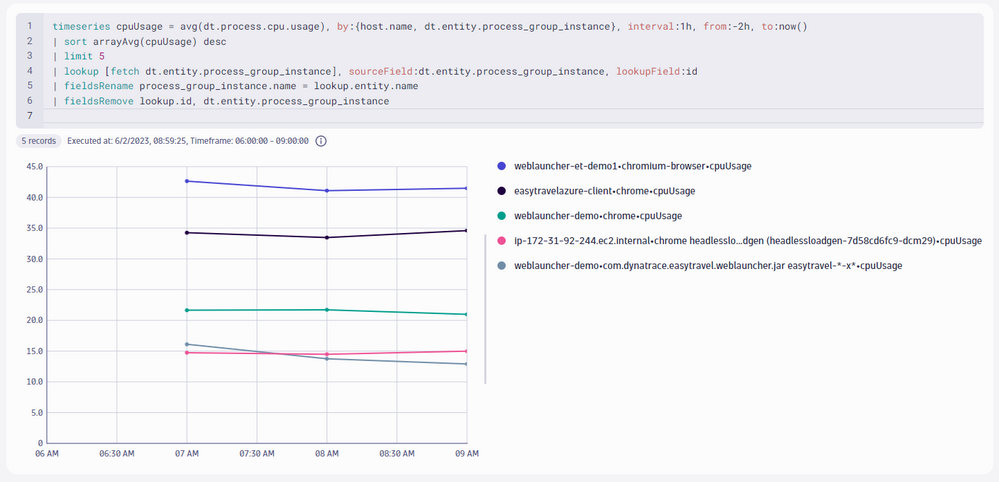
timeseries cpuUsage = avg(dt.process.cpu.usage), by:{host.name, dt.entity.process_group_instance}, interval:1h, from:-2h, to:now()
| sort arrayAvg(cpuUsage) desc
| limit 5
| lookup [fetch dt.entity.process_group_instance], sourceField:dt.entity.process_group_instance, lookupField:id
| fieldsRename process_group_instance.name = lookup.entity.name
| fieldsRemove lookup.id, dt.entity.process_group_instance
Let's break this down:
- you need a
lookupcommand to get from the PGI id on the timeseries to the name of the PGI - you are most likely looking for the processes with the highest average CPU in the selected timeframe. Therefore, use
avgas aggregation in the timeseries command, and combine it withsort arrayAvg(cpuUsage) desc, which calculates the average for each process in the whole timeframe, and the sorts by that values descending. fieldsRenameis only used to get a nicer name (instead of the default oflookup.entity.name)fieldsRemoveis used to remove the PGI id fields to have a simpler series label
Let me know if this helps!
- Mark as New
- Subscribe to RSS Feed
- Permalink
02 Jun 2023 03:34 PM
Thanks @stefan_eggersto for the reply.
I really appreciate your help.
I may not ask the question correctly. Below is what the final result I want will be.
The goal is for each host monitored in Dynatrace, get the top 5 processes.
Not all the fields are needed to be the same at the DQL results as long as I can some transform jobs on it and get it.
| Time_from | Time_to | Host name | Process name | value |
| 2023-06-02 07:00 | 2023-06-02 08:00 | Host A | Process A | 10 |
| Process B | 9 | |||
| Process C | 8 | |||
| Process D | 7 | |||
| Process E | 6 | |||
| Host B | Process F | 12 | ||
| Process B | 10 | |||
| Process K | 8 | |||
| Process L | 6 | |||
| Process I | 4 | |||
| ... and then all hosts or I will add a filter to select only the osType is LINUX | ... | ... | ||
| 2023-06-02 08:00 | 2023-06-02 09:00 | Host A | Process A | 11 |
| Process F | 3 | |||
| Process L | 5 | |||
| Process O | 9 | |||
| Process I | 6 | |||
| Host B | Process Z | 12 | ||
| Process U | 10 | |||
| Process K | 8 | |||
| Process L | 6 | |||
| Process I | 4 | |||
| ... | ... | ... |
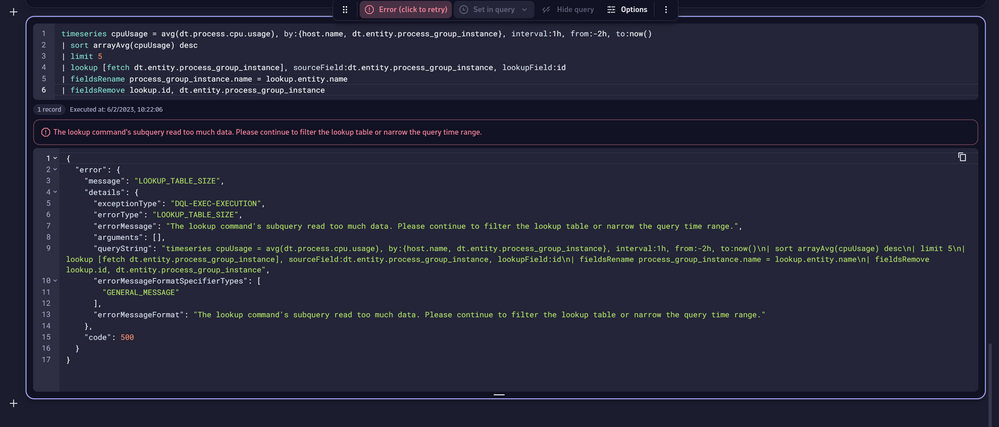
Also, I want to know the limitation for DQL. I tried to execute it at Notebook and also '/query:execute' API. Below error was shown.
- Mark as New
- Subscribe to RSS Feed
- Permalink
02 Jun 2023 05:52 PM
This query should work for you
timeseries cpuUsage = avg(dt.process.cpu.usage),
  by:{host.name, dt.entity.process_group_instance, dt.entity.host}, interval:1h, from:-2h, to:now()
| lookup [
  timeseries cpuUsage = avg(dt.process.cpu.usage),
    by:{host.name, dt.entity.host, dt.entity.process_group_instance},interval:1h, from:-2h, to:now()
  | fieldsAdd cpuUsage = arrayAvg(cpuUsage)
  | filter cpuUsage != 0
  | sort dt.entity.host asc, cpuUsage desc
  | summarize cpu=collectArray(cpuUsage), by: dt.entity.host
  | fieldsadd threshold= if(arraySize(cpu)>= 5,cpu[4],else:0)
  | fieldsadd threshold= if(arraySize(cpu) == 4,cpu[3],else:threshold)
  | fieldsadd threshold=if(arraySize(cpu)== 3,cpu[2],else:threshold)
  | fieldsadd threshold=if(arraySize(cpu)== 2,cpu[1],else:threshold)
  | fieldsadd threshold=if(arraySize(cpu)== 1,cpu[0],else:threshold)
  | fields dt.entity.host, threshold
], sourceField:dt.entity.host, lookupField:dt.entity.host
| filter arrayAvg(cpuUsage) >= lookup.threshold
| fields cpuUsage, host.name, timeframe, interval, dt.entity.process_group_instance
| lookup [fetch dt.entity.process_group_instance], sourceField:dt.entity.process_group_instance, lookupField:id
| fieldsRename process_group_instance.name = lookup.entity.name
| fieldsRemove lookup.id
| sort host.name asc, cpuUsage desc
| fields start=timeframe[start], end=timeframe[end], Host=host.name, Process=process_group_instance.name, arrayAvg(cpuUsage)
I have adapted the query a bit. For every process, I am doing here a lookup to find out what is the cpu threshold of the top processes on the host. After you have the threshold, you just filter to be above or equal to the top5 processes.
Regarding DQL limitations and the lookup command. One of its main purposes is to "lookup" the entity name for a certain entity id. So it is not a proper join command as you might know it from SQL. Therefore it has a limit when it comes to reading data.
Best,
Sini
- Mark as New
- Subscribe to RSS Feed
- Permalink
05 Jun 2023 04:05 PM - edited 05 Jun 2023 08:49 PM
Thanks @sinisa_zubic for the reply.
I am not sure if my understanding to your DQL query is correct or not. seems like the top 5 processes of a host will always be the same for the 2 hours. The result is something like:
| time_from | time_to | host name | process name | value |
| 2023-06-02 07:00 | 2023-06-02 09:00 | Host A | Process C | [ 12, 10] |
For each hour, I want to get the top 5 process of each host.
Regarding the limitation of DQL, seems like the number of dt.entity.process_group_instance is too large in my company.
Every time I added:
| lookup [fetch dt.entity.process_group_instance], sourceField:dt.entity.process_group_instance, lookupField:id
| fieldsRename process_group_instance.name = lookup.entity.name
| fieldsRemove lookup.id
it will always show the error.
I will try out other way to pass the name to the result.
- Mark as New
- Subscribe to RSS Feed
- Permalink
12 Jun 2023 08:40 PM
Below may be a solution that can get the process name.
fetch dt.entity.process_group_instance
| lookup [
  timeseries cpuUsage = avg(dt.process.cpu.usage),
  by:{host.name, dt.entity.process_group_instance, dt.entity.host, process.name},
  interval:1h,
  from: "2023-06-02T18:00:00.000Z",
  to: "2023-06-02T19:00:00.000Z"
  | filter startsWith(dt.entity.host, "HOST-A")
  | lookup [
    timeseries cpuUsage = avg(dt.process.cpu.usage),
      by:{host.name, dt.entity.host, dt.entity.process_group_instance},interval:1h, from:"2023-06-02T18:00:00.000Z", to:"2023-06-02T19:00:00.000Z"
    | fieldsAdd cpuUsage = arrayAvg(cpuUsage)
    | filterOut  cpuUsage == 0
    | sort dt.entity.host asc, cpuUsage desc
    | summarize cpu = collectArray(cpuUsage), by: {dt.entity.host}
    | fieldsAdd threshold = if(arraySize(cpu) >= 5,cpu[4], else: 0)
    | fieldsAdd threshold = if(arraySize(cpu) < 5 AND arraySize(cpu) > 0, cpu[-1], else: threshold )
    | fields dt.entity.host, threshold
  ], sourceField:dt.entity.host, lookupField:dt.entity.host
], sourceField:id, lookupField:dt.entity.process_group_instance
| filterOut isNull(lookup.dt.entity.host)
| filter arrayAvg(lookup.cpuUsage) >= lookup.lookup.threshold
| sort lookup.host.name
Line 8 " | filter startsWith(dt.entity.host, "HOST-A")" needed to be added so that the query can return some results. Otherwise, the query will also return the error of "the lookup table is too large"
However, this solution is not scalable. I am still looking for a scalable solution to this.
Thanks.
- Mark as New
- Subscribe to RSS Feed
- Permalink
15 Jun 2023 05:20 PM
Can you maybe share how many dt.entity.process_group_instance records you have in your environment? I am a bit surprised that you are running there with the lookup into a limitation. I was testing the query in an environment with 90k process group instances - and it was running without any problems.
Best,
Sini
- Mark as New
- Subscribe to RSS Feed
- Permalink
15 Jun 2023 05:32 PM
There are >300k process group instances in the environment.
Stephen
- Mark as New
- Subscribe to RSS Feed
- Permalink
15 Jun 2023 05:15 PM
Regarding "seems like the top 5 processes of a host will always be the same for the 2 hours" - this is because in the "from" parameter I have specified "-2h" hours. So changing it to -1h should solve that. But I see in your next query you have already managed to to it with a 1h timeslot.
My query was just looking of the top5 processes of the last 2h. But looking at the table I now understand what you are looking for. For every hour the top5 processes per host - looking back x hours. I am not aware of a way how you would achieve this "only" with DQL and I have also discussed this with colleagues. Maybe you can share what you would like to do with that information?
Best,
Sini
- Mark as New
- Subscribe to RSS Feed
- Permalink
15 Jun 2023 05:44 PM - edited 15 Jun 2023 05:49 PM
It is a capacity planning project. We would like to extract the metrics data from Dynatrace to a designated place to do some reporting.
For other metrics like CPU usage, we use the Metrics API to do that.
But, one of the reports is to get top N process of each host for each hour.
At first, we tried with Metrics API but it also exceeds its limit. So, we switch to DQL and try to get the job done.
- Mark as New
- Subscribe to RSS Feed
- Permalink
16 Jun 2023 02:36 PM
Thx for the insights. One way I can achieve this is with Dynatrace workflows. You could create a workflow that calculates the top5 processes for every host and ingest that information back into Dynatrace (e.g. as logs or biz events). The workflow can be scheduled to be executed every hour. Then you would have the data easy accessible with DQL.
Improvements on the DQL side are in the making, so that you don't have to go that way through workflows. But I can't give you any ETA on that.
Best,
SIni
Featured Posts


