This website uses Cookies. Click Accept to agree to our website's cookie use as described in our Privacy Policy. Click Preferences to customize your cookie settings.
DQL
Questions about Dynatrace Query Language
Turn on suggestions
Auto-suggest helps you quickly narrow down your search results by suggesting possible matches as you type.
- Dynatrace Community
- Ask
- DQL
- Re: Node.js Event Loop metrics to Dashboards V2
Options
- Subscribe to RSS Feed
- Mark Topic as New
- Mark Topic as Read
- Pin this Topic for Current User
- Printer Friendly Page
Add Node.js Event Loop Metrics to Dashboards V2 Using DQL
Options
- Mark as New
- Subscribe to RSS Feed
- Permalink
20 May 2024
08:48 AM
- last edited on
18 Dec 2025
02:29 PM
by
![]() IzabelaRokita
IzabelaRokita
4 REPLIES 4
Options
- Mark as New
- Subscribe to RSS Feed
- Permalink
22 May 2024 04:22 PM
Hi @mouru ,
Your image seems to only show the result of your tile. It also looks as though you were using some kind of a query to create this dashboard - if so, what was the query that you used to create the timeseries? If not, how did you create this tile?
Dynatrace ACE Services Consultant
Options
- Mark as New
- Subscribe to RSS Feed
- Permalink
23 May 2024 06:32 AM
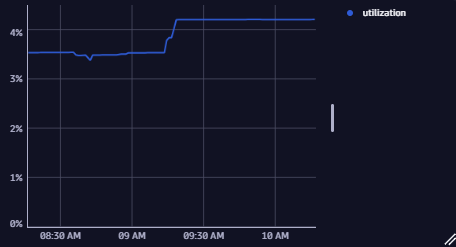
This timeseries is straight from Data Explorer, which shows the Event Loop Utiliziation correctly, I just pressed the Open with Dashboards.
The query:
timeseries utilization=avg(dt.runtime.nodejs.eventloop.utilization), by: { dt.entity.process_group_instance } , filter: { in(dt.entity.process_group_instance, classicEntitySelector("type(process_group_instance),entityName.equals(process_name)")) }
Options
- Mark as New
- Subscribe to RSS Feed
- Permalink
19 Feb 2025 09:23 AM - edited 19 Feb 2025 09:26 AM
Hi, now that most of the NodeJS metrics are available in Grail, when will the tick frequency and tick duration made available in Grail?
builtin:tech.nodejs.uvLoop.totalTime
builtin:tech.nodejs.uvLoop.count
It seems to be not available at all here:
https://docs.dynatrace.com/docs/analyze-explore-automate/metrics/built-in-metrics-on-grail#node-js
Options
- Mark as New
- Subscribe to RSS Feed
- Permalink
18 Dec 2025 02:29 PM
Hey @mouru ,
I just wanted to check in and see if you still need help with this. If so, I’d be happy to look into it for you! 😊
Please let me know what works best for you.
Featured Posts
