- Dynatrace Community
- Ask
- Dashboarding
- Adding mssql server monitoring to dashboard
- Subscribe to RSS Feed
- Mark Topic as New
- Mark Topic as Read
- Pin this Topic for Current User
- Printer Friendly Page
- Mark as New
- Subscribe to RSS Feed
- Permalink
14 Sep 2022
10:44 AM
- last edited on
24 May 2023
10:18 AM
by
![]() Michal_Gebacki
Michal_Gebacki
I've already configured my monitoring endpoint for mssql server extension, how do I add them to dashboard?
Solved! Go to Solution.
- Mark as New
- Subscribe to RSS Feed
- Permalink
14 Sep 2022 10:50 AM
Hi, check this https://dynatrace.github.io/BizOpsConfigurator/#prerequisites
It has predefined dashboards for different uses cases included mssql server dashboards.
- Mark as New
- Subscribe to RSS Feed
- Permalink
14 Sep 2022 11:02 AM
sorry but can you direct me to the mssql server dashboard? can't seem to find it, also is there any other way to create the dashboard directly from dynatrace instead of using API?
- Mark as New
- Subscribe to RSS Feed
- Permalink
09 Apr 2026 01:46 PM
Dear @msec_dt
Could you post a direct link, and also appreciate if there is the same for SQL Server.
Thanks
- Mark as New
- Subscribe to RSS Feed
- Permalink
14 Sep 2022 03:17 PM
Hi @leonatay
Could you please try the attached one? Import it in to the Dashbords.
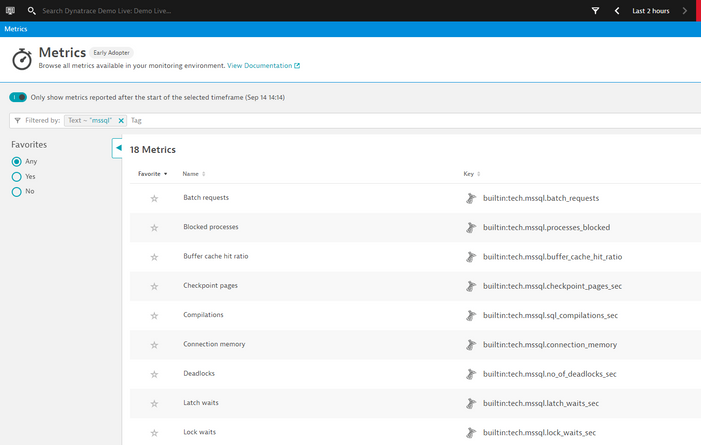
If it is not enough check your metrics brower for your mssql metrics and create chartes form them.
Br, Mizső
- Mark as New
- Subscribe to RSS Feed
- Permalink
09 Apr 2026 01:29 PM
Thanks @Mizső for your contribution
Do you have the same Dashboard for SQL Server?
thanks
Featured Posts

