This website uses Cookies. Click Accept to agree to our website's cookie use as described in our Privacy Policy. Click Preferences to customize your cookie settings.
Dashboarding
Dynatrace dashboards, notebooks, and data explorer explained.
Turn on suggestions
Auto-suggest helps you quickly narrow down your search results by suggesting possible matches as you type.
- Dynatrace Community
- Ask
- Dashboarding
- Link the metric CPU I/O wait time
Options
- Subscribe to RSS Feed
- Mark Topic as New
- Mark Topic as Read
- Pin this Topic for Current User
- Printer Friendly Page
Options
- Mark as New
- Subscribe to RSS Feed
- Permalink
03 Jun 2025
03:24 PM
- last edited on
01 Dec 2025
01:59 PM
by
![]() Michal_Gebacki
Michal_Gebacki
Hello
I am looking for a way to link the metric CPU I/O Wait time (builtin:host.cpu.iowait) with the disks the CPU is waiting for in the data explorer.
Anyone has an idea how to construct such a query?
thank you in advance
Solved! Go to Solution.
Labels:
- Labels:
-
data explorer
Reply
1 REPLY 1
Options
- Mark as New
- Subscribe to RSS Feed
- Permalink
03 Jun 2025 04:33 PM
Hi @svendb1803, great question.
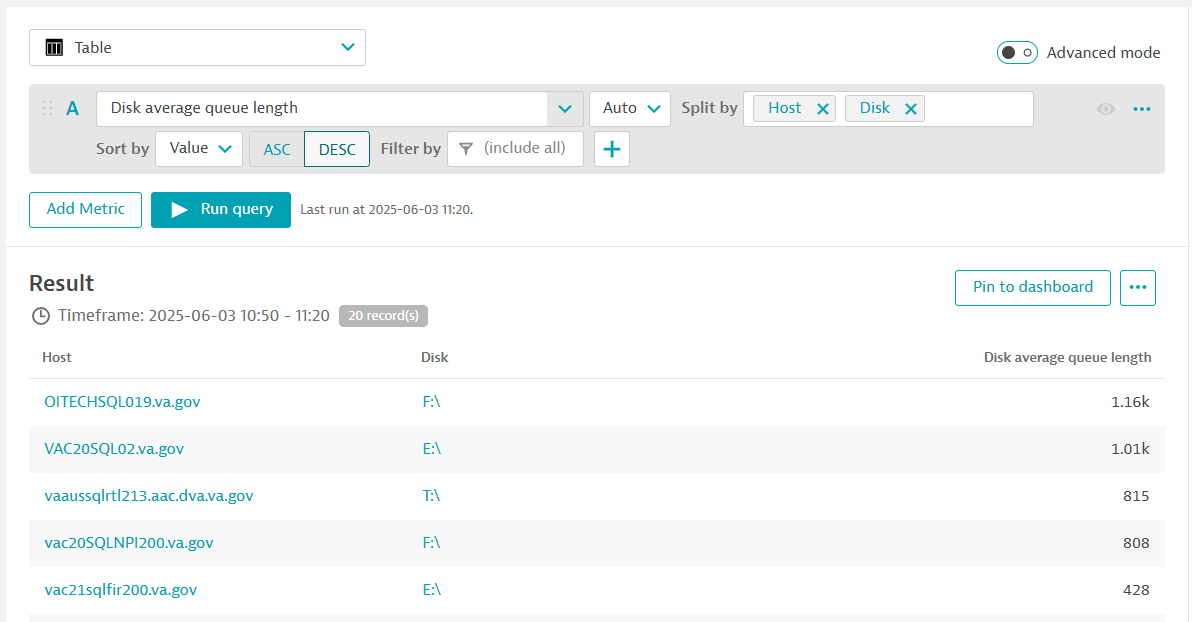
CPU I/O Wait time is a great metric for identifying hosts that are experiencing wait time generally, however you may find Disk Average Queue Length (builtin:host.disk.queueLength) to be more useful for your purposes. This metric can display both the host, and disks, in the same view.
Unfortunately, this metric doesn't show definitively whether a disk is causing wait time or not, but it does show disk queue length. If you already know a host CPU that is experiencing wait time, filtering this query by host should shed some light on which disks are working the hardest.
Here is the Advanced Mode query I created:
builtin:host.disk.queueLength:splitBy("dt.entity.host","dt.entity.disk"):sort(value(auto,descending)):limit(20)
I've also attached an image of the visual query.
I hope this helps!
data-explorer-query.png
31 KB
Reply
Featured Posts
