This website uses Cookies. Click Accept to agree to our website's cookie use as described in our Privacy Policy. Click Preferences to customize your cookie settings.
Dashboarding
Dynatrace dashboards, notebooks, and data explorer explained.
Turn on suggestions
Auto-suggest helps you quickly narrow down your search results by suggesting possible matches as you type.
- Community Home
- Platform
- Dashboarding
- Create business journey dashboard by USQL
Options
- Subscribe to RSS Feed
- Mark Topic as New
- Mark Topic as Read
- Pin this Topic for Current User
- Printer Friendly Page
Options
- Mark as New
- Subscribe to RSS Feed
- Permalink
17 Nov 2020
07:54 AM
- last edited on
06 May 2021
01:00 PM
by
![]() MaciejNeumann
MaciejNeumann
Hi All,
How try create journey dashboard for this picture?
How can write usql ?
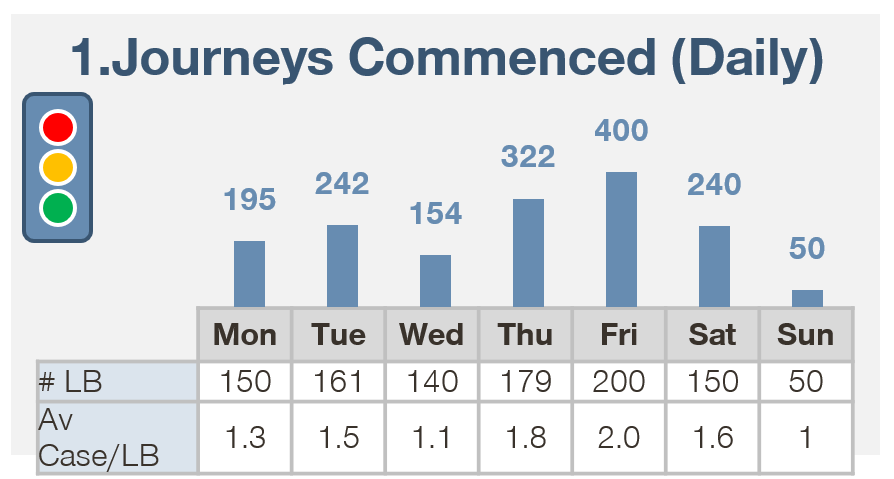
descriptions
-Bar chart is average of all usersession
-LB is average of userId by tag
-Av Case/LB is LB divide Bar chart
Thank you.
Solved! Go to Solution.
Labels:
- Labels:
-
dashboards classic
-
user sessions
-
usql
2 REPLIES 2
Options
- Mark as New
- Subscribe to RSS Feed
- Permalink
17 Nov 2020 06:19 PM
I'm not 100% sure we can include the division and the weekly dates in a chart. The basic chart I was able to create was the following:
SELECT COUNT(userId) FROM usersession WHERE useraction.application="**APPNAME**"
You can expand on this but I'm not sure if you can get the math in place or the dates as the time goes by the Time Frame Selector on the top of the screen.
-Chad
Reply
Options
- Mark as New
- Subscribe to RSS Feed
- Permalink
18 Nov 2020 05:57 AM
Hi chad,
Thanks for your response.
Featured Posts
