This website uses Cookies. Click Accept to agree to our website's cookie use as described in our Privacy Policy. Click Preferences to customize your cookie settings.
Dashboarding
Dynatrace dashboards, notebooks, and data explorer explained.
Turn on suggestions
Auto-suggest helps you quickly narrow down your search results by suggesting possible matches as you type.
- Community Home
- Platform
- Dashboarding
- Re: Can we create a Custom report/chart for synthetic Clickpath browser monitor with average duration of each clickpath in Dynatrace SaaS?
Options
- Subscribe to RSS Feed
- Mark Topic as New
- Mark Topic as Read
- Pin this Topic for Current User
- Printer Friendly Page
Options
- Mark as New
- Subscribe to RSS Feed
- Permalink
21 Mar 2018
12:36 PM
- last edited on
31 Aug 2022
11:26 AM
by
![]() MaciejNeumann
MaciejNeumann
Can we create a Custom report/chart for synthetic Clickpath browser monitor with an average duration of each clickpath in Dynatrace SaaS?
Solved! Go to Solution.
Labels:
7 REPLIES 7
Options
- Mark as New
- Subscribe to RSS Feed
- Permalink
21 Mar 2018 02:05 PM
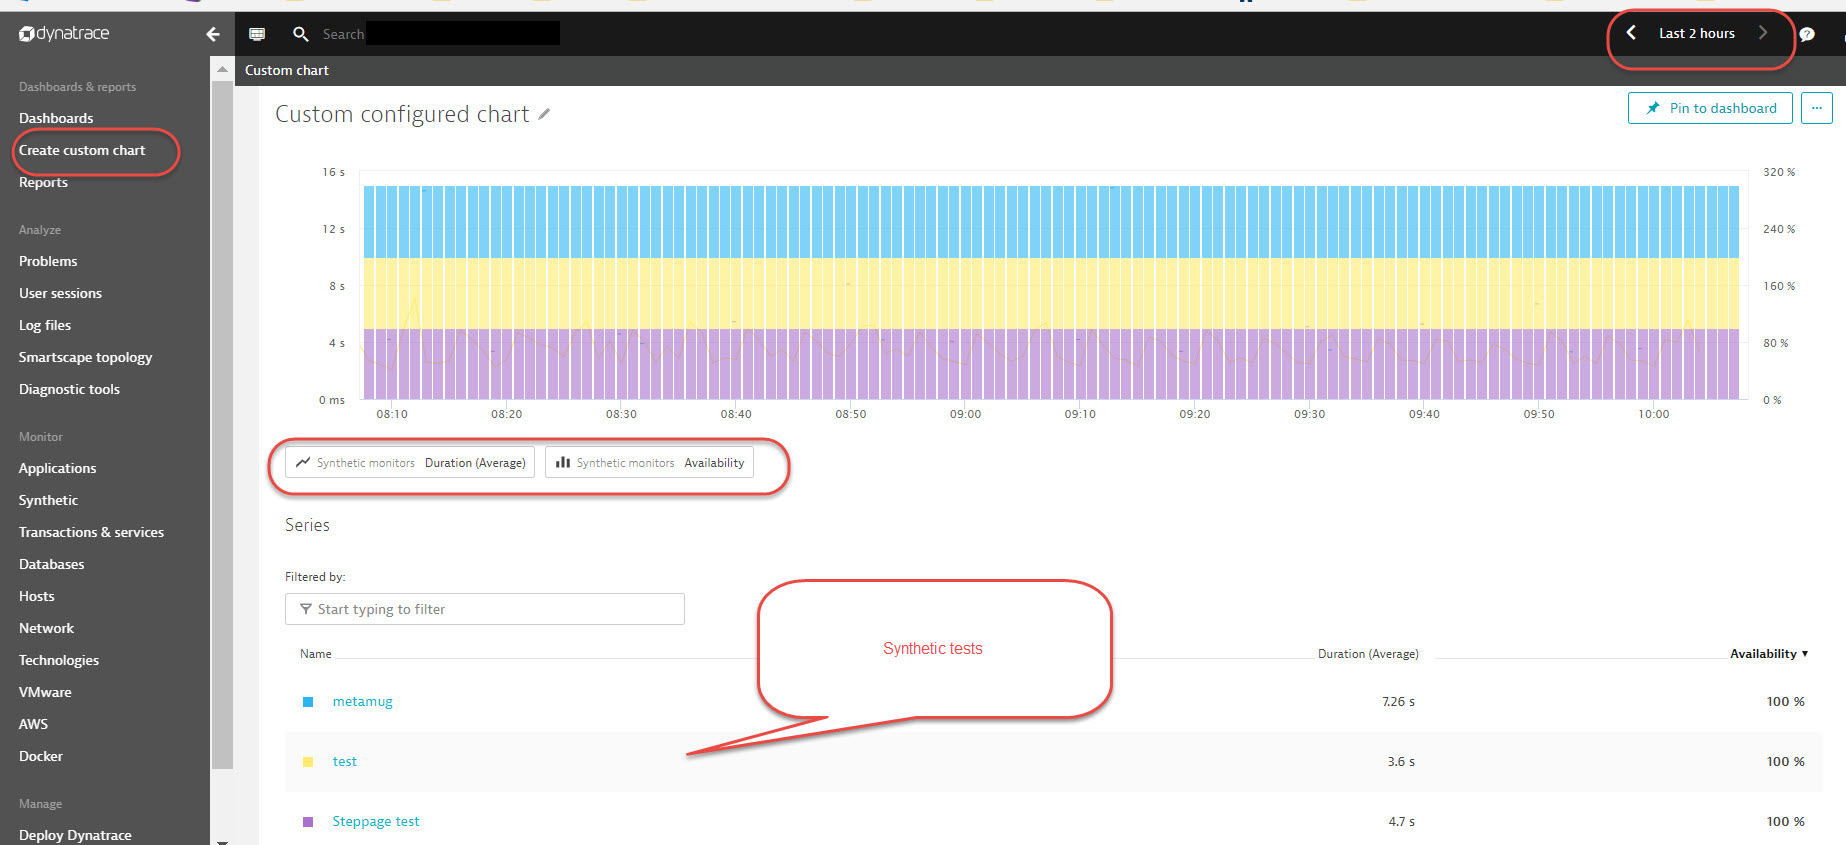
Did you try the Create Custom Chart option from the Menu? When using this option, search for metrics Synthetic-Duration for Performance of the Synthetic test, and Synthetic- Availability for the availability of all the Synthetic tests. You may then select desired time frame using the universal time selection on right corner.
Options
- Mark as New
- Subscribe to RSS Feed
- Permalink
22 Mar 2018 05:55 AM
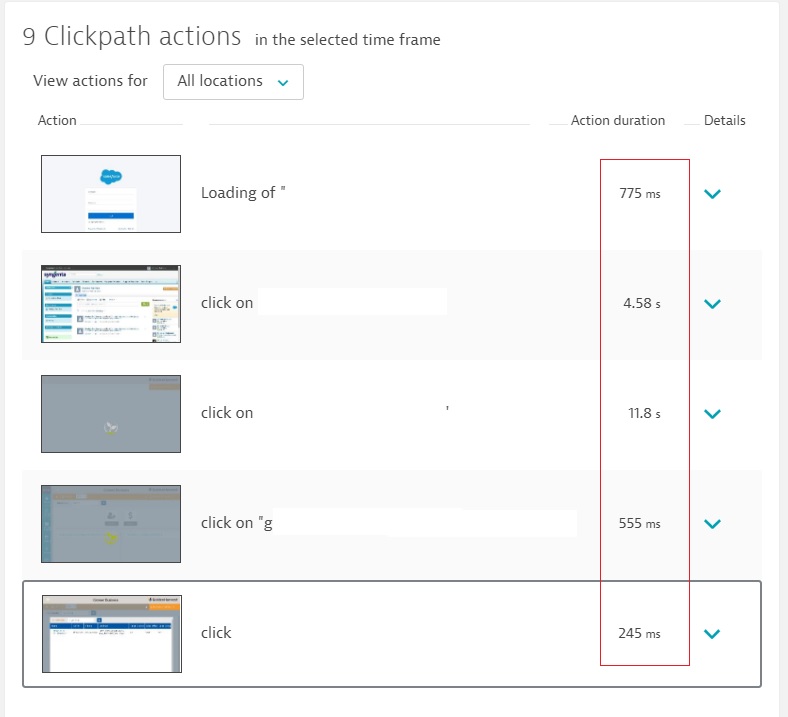
Hi Bharathi, Thanks for your response, I actually tried the custom chart option but this will give the average value of a metric(Duration/Availability) for the entire Synthetic Monitor/Test, but i was looking for report/tile that shows average duration for each individual click in a clickpath route. We can actually see this info when we click on a synthetic test .Please see the pic below.For the selected duration i am looking for a chart with average action duration for each click/action in the clickpath Monitor. This seems to be similar to Step analysis report in Synthetic Classic but this report is not available on Synthetic SaaS. Any help on this would be much appreciated. Thanks.
Options
- Mark as New
- Subscribe to RSS Feed
- Permalink
22 Mar 2018 04:34 PM
I understood your requirements now. I am afraid we do not have such options present other than to use the Clickpath actions section that you have shown above. you could post an idea that our PMs might consider.
Options
- Mark as New
- Subscribe to RSS Feed
- Permalink
23 Mar 2018
04:43 AM
- last edited on
16 Oct 2023
04:06 PM
by
![]() random_user
random_user
Options
- Mark as New
- Subscribe to RSS Feed
- Permalink
27 Mar 2018 10:25 PM
@Srinivas V. Did you try the API call to have this information?
https://xxxx.live.dynatrace.com/api/v1/timeseries?Api-Token=xxxx×eriesId=com.dynatrace.builtin:webcheck.step.performance.actionduration&relativeTime=hour&aggregationType=avg
Options
- Mark as New
- Subscribe to RSS Feed
- Permalink
26 Jan 2022 03:41 PM - edited 31 Jan 2022 11:28 AM
Two product ideas related to this topic have been accepted and completed.
Add a Custom Report/Chart to show the average action duration of each click path action in a click path browser monitor on Dynatrace SaaS
https://community.dynatrace.com/t5/Dynatrace-product-ideas/Add-a-Custom-Report-Chart-to-show-the-ave...
Synthetic Availability By Step/Action Reporting
https://community.dynatrace.com/t5/Dynatrace-product-ideas/Synthetic-Availability-By-Step-Action-Rep...
This can be helpful:
Record a browser clickpath
https://www.dynatrace.com/support/help/how-to-use-dynatrace/synthetic-monitoring/browser-monitors/re...
⭐ When passion meets people magic and innovation happen. ⭐
Options
- Mark as New
- Subscribe to RSS Feed
- Permalink
17 Feb 2022 12:05 PM
Here is a quick query created by Dynatrace Product Manager - Philipp Kastner:
builtin:synthetic.browser.event.visuallyComplete.load:splitBy("dt.entity.synthetic_test_step"):parents:filter(and(eq("dt.entity.synthetic_test","SYNTHETIC_TEST-3F7B564D3AC5375C"))):avg:auto:sort(value(avg,descending)):limit(10)
=> The SYNTHETIC_TEST-3F7B564D3AC5375 needs to be replaced with the monitor you want to chart.
An easy way to filter for parent entities with the UI (not custom query needed) is planned for the 2nd quarter of 2022
⭐ When passion meets people magic and innovation happen. ⭐
Featured Posts
