- Dynatrace Community
- Ask
- Dashboarding
- Dashboard and Data Explorer tips
- Subscribe to RSS Feed
- Mark Topic as New
- Mark Topic as Read
- Pin this Topic for Current User
- Printer Friendly Page
- Mark as New
- Subscribe to RSS Feed
- Permalink
01 Feb 2022
04:06 PM
- last edited on
30 May 2023
02:25 PM
by
![]() Michal_Gebacki
Michal_Gebacki
For quite some time I was thinking about putting together a few things I've learned and come across regularly, since I joined the Dashboarding and Data explorer band wagon.
So rather than wait until I get the time to write a proper blog post, I thought why not start small and iterate. So here we are:
Shift the timeframe for METRICs relative to the selected timeframe (aka :timeshift transformation)
Something we even documented by now, pls check out https://www.dynatrace.com/support/help/shortlink/explorer-advanced-query-editor#example-compare-a-me... and let us know whether something isn't clear or missing.
The TLTR; with the :timeshift transformation in the Data explorer code mode you can shift single metrics in comparison to others. So that on a dashboard you choose last 7 days, for example, your first metric (line) shows you the traffic from this week, while your shifted metric 2 shows you the line from last week. Both use the global timeframe selector as a reference and both metrics (shifted and unshifted) dynamically change based on that.
When to use the :timeshift transformation? When you want to compare two or more metrics for a different timeframe in a single visualization. E.g in a graph/line chart.
A static shift would be to use the TILE settings on the dashboard tile, where you define either a certain timeframe or relative timeframe for the whole tile. This applies to all metrics in that tile.
When to use the tile settings: When you need different timeframes for different visualizations. E.g. State visualizations (last day, last 2 h,...) vs. trend based visualizations (last 30 days) on the same dashboard. Tip: obviously querying smaller timeframes should also be more performant, so you might end up
Working with rates
Sometimes you are not interested in the absolute count but in the rate (common for APM cases). This is how you can transform it:
The original metric:
builtin:apps.web.actionCount.category:splitBy():sum:auto:sort(value(sum,descending)):limit(10)
The :rate transformation applied, tells the Metrics API, pls transform this to a per minute number, so you don't have to do the math. Tipp: should your metric not support rate automatically (its no number by default) than use :auto:rate(..) to fix it.
builtin:apps.web.actionCount.category:splitBy():sum:auto:sort(value(sum,descending)):limit(10):rate(1m)
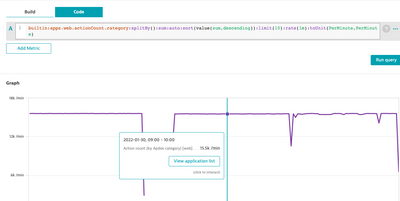
Finally :toUnit (silently available since 1.228) to set the unit accordingly and have the beloved /m... in the charts
builtin:apps.web.actionCount.category:splitBy():sum:auto:sort(value(sum,descending)):limit(10):rate(1m):toUnit(PerMinute,PerMinute)
The result:
Sort by (metric entity) names instead of their values
Sometimes you want to sort your visualization results, for example in a table or heatmap, alphabetically rather than according to the values in case you used split by.
Let's look at an easy example:
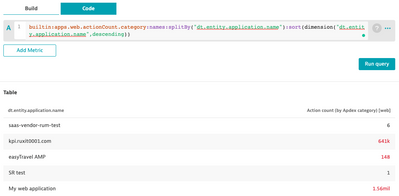
Sorted by name:
- add :names right after the metric name
- Split by "dt.entity..... .name" (you can also split by only the entity to get the drill down link, for example in a table.
- change :sort to dimension(dt.entity.... .name, [ascending/descending])
Note: we treat upper- and lower-case differently and sort them one after the other. So don't be surprised to see, for instance, something like:
- Adelaide
- Berlin
- Cleveland ... but then
- atlanta
- boston
- c...
Sorting by value (out of the box default):
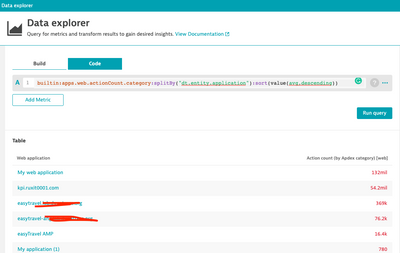
Searching metrics made easy with additional search terms
While with Custom charting we provided a naive matching between the metric key and the "category" of our metrics, I'd argue you can do pretty much the same with the Data explorer and probably most of you just don't know this yet! But let's talk examples:
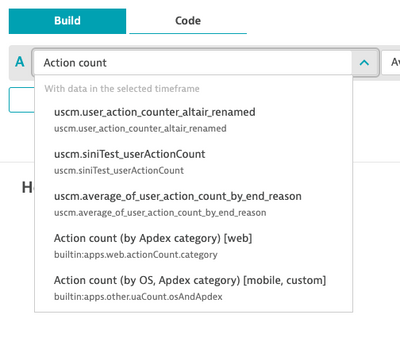
E.g. when you look for certain "application" metrics you sometimes end up with "premature" results like the following:
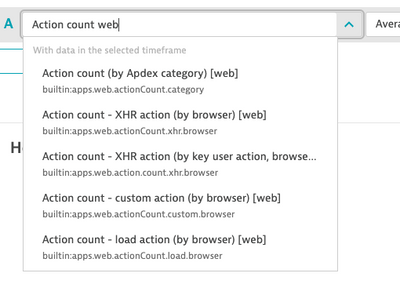
Since the search term provided is matched against the display name as well as the key by adding additional words like, app or web will do the trick here and only display you the desired and relevant builtin metrics. This of course works for all others - e.g. add additional words like "services".. or "process" or any other entity type to refine your search result and get to relevant metrics faster.
Replacing missing values like a bo$$
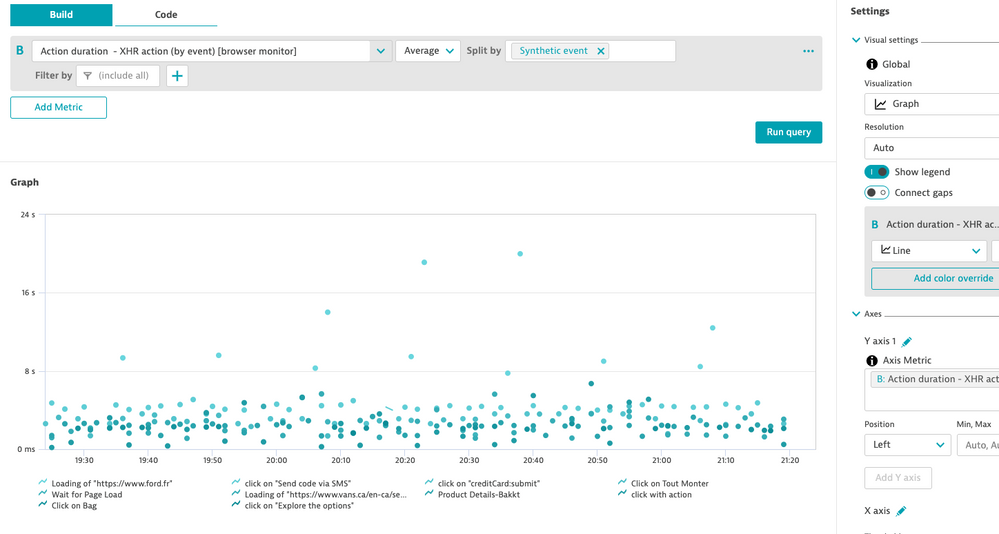
The basis a synthetic-based event metric:
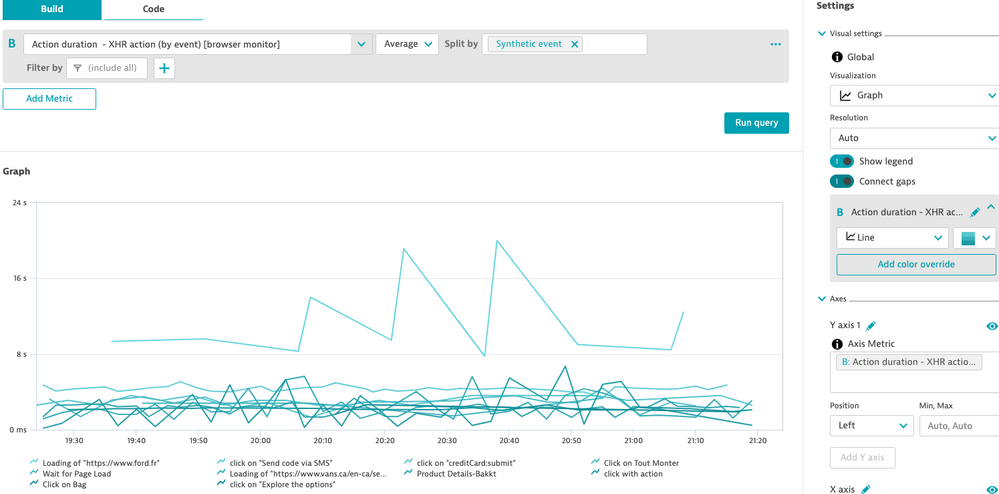
Naive missing value replacement strategy - connect gaps (use build mode):
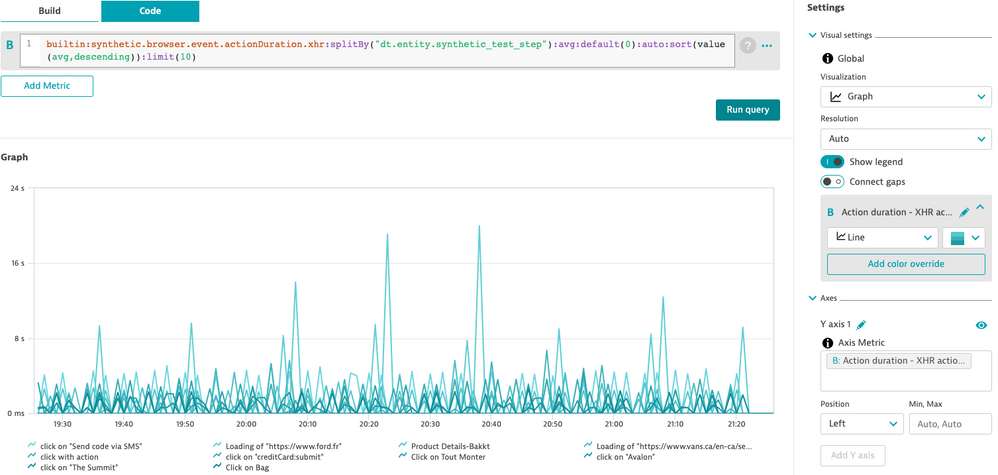
What if you want to set all missing values to 0? Easy with the code mode and the :default() transformation. https://www.dynatrace.com/support/help/shortlink/api-metrics-v2-selector#default
Note: only replaces all null values with 0, in the series, if at least one data point exists within the selected timeframe.
Advanced filtering with code mode
I often come across the request to filter all entities that don't match a certain name.
Use not and other suitable conditions of the entity selector to efficiently narrow them down or to remove them. Let's look at an example:
For builtin metrics when you need to use the entity name
Where we usually use "ids" instead of "names" you would use the entity selector.
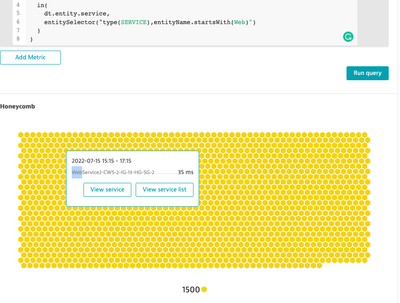
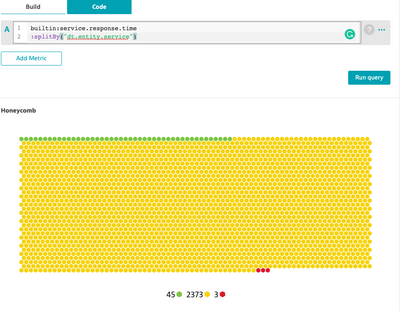
For example, to get a honeycomb for the Response time of all our "Web" services, indicated by Web at the beginning of their names, we could do the following:
builtin:service.response.time
:splitBy("dt.entity.service")
:filter(
  in(
    dt.entity.service,
    entitySelector("type(SERVICE),entityName.startsWith(Web)")
  )
)
while without the filter, we'd get
For your own ingested metrics
you can leverage the simpler syntax without an entity selector like
weather.info.temperature
:splitBy("station")
:filter(prefix("station","EU-"))
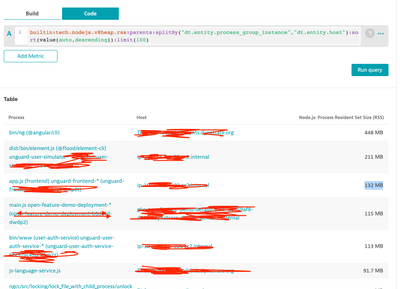
Can I show the host for a PGI?
Yes, you (code mode) can!
1. add :parents after the metrics name
2. add the desired dimension, in this case "dt.entity.host", to the splitBy
How can I get a hive with more than 100 honeycombs?
You previously created a honeycomb but were bothered by the fact that the max limit of 100 is limiting your bird's eye view? Well, that's the solution:
1. Pick a metric of your choice (e.g., Response time - a service metric)
2. Use the desired splitBy criteria (e.g. Service)
3. Select Honeycomb in the visualization
4. Switch to Code mode and inside limit(100) replace the number with a higher one. For example 5000.
Voila. almost 2.5K services at a glance.
regards
Thomas
Solved! Go to Solution.
- Mark as New
- Subscribe to RSS Feed
- Permalink
31 Mar 2022 02:40 PM
This is great! thanks @zietho
- Mark as New
- Subscribe to RSS Feed
- Permalink
15 Jun 2022 09:07 PM
Thanks for this! We're using code more and more and examples of specific use cases is of great help.
Special request for volume 2 (which I hope is coming soon): filter on relations (example: response time of all the services related to a specific process group).
- Mark as New
- Subscribe to RSS Feed
- Permalink
16 Jun 2022 07:14 AM
Thanks @zietho This will help in release comparison for our clients where weekly release are getting deployed 🙂
- Mark as New
- Subscribe to RSS Feed
- Permalink
16 Jun 2022 07:21 AM
The advanced filtering capabilities are really cool indeed. Especially when you get familiar with the entity selectors.
For example, the following query will show you the failure of services which are called from services running in a process group named prodCluster tagged with a tag named TAG1. Such queries are really cool with honeycomb visualizations.
builtin:service.errors.total.rate
:splitBy("dt.entity.service")
:filter(in("dt.entity.service",entitySelector("type(SERVICE),toRelationships.calls(type(SERVICE),tag(TAG1),fromRelationships.runsOn(type(PROCESS_GROUP),entityName(prodCluster)))")))
:avg
:auto
:sort(value(avg,descending))
:limit(100)
- Mark as New
- Subscribe to RSS Feed
- Permalink
22 Aug 2022 11:33 AM
Added "Sort by (metric entity) names instead of their values", long needed and often asked. Yes, we plan to add this to build mode ;)!
- Mark as New
- Subscribe to RSS Feed
- Permalink
14 Sep 2022 06:53 PM
@zietho Hello and thank you for your post! Right now I'm running into an issue where I'm unable to increase the returned information past 100 despite using the code tab. Any ideas?
- Mark as New
- Subscribe to RSS Feed
- Permalink
16 Nov 2022 07:51 PM
Sorry I totally missed this! Did you try it for honeycombs? And it only works from a certain version onwards. Did it work in the meantime?
- Mark as New
- Subscribe to RSS Feed
- Permalink
21 Nov 2022 04:54 PM
No worries, and thank you for the reply. Yes, I believe this has to do with the version of DT we're on. Thanks!
- Mark as New
- Subscribe to RSS Feed
- Permalink
16 Nov 2022 06:54 PM
Great work. I used this to figure what services in our tenants have Key Requests and put a key request and service together. Of course, I have used for other things also.
- Mark as New
- Subscribe to RSS Feed
- Permalink
18 Jan 2024 07:47 AM
thanks for sharing this tips
Featured Posts
