- Dynatrace Community
- Ask
- Dashboarding
- Re: Dashboard for top management/executive level
- Subscribe to RSS Feed
- Mark Topic as New
- Mark Topic as Read
- Pin this Topic for Current User
- Printer Friendly Page
- Mark as New
- Subscribe to RSS Feed
- Permalink
28 Feb 2022
09:51 AM
- last edited on
25 May 2023
01:49 PM
by
![]() Michal_Gebacki
Michal_Gebacki
Dear all,
any idea on what can we showcase on the dashboard for the top management/executive level to view. I just started using Dynatrace. So I'm just not sure what are the things that we can put.
This is what I have included so far in the Dashboard.
- the server health for all server
- Separate the type of Applications with the server eg Cyberark, Sailpoint, OKTA etc.
- Top 10 list Disk usage for each application.
Appreciate it if guys can shed some light based on your current environment.
Thank you so much for your help.
Thanks,
Regard,
Afrezal
Solved! Go to Solution.
- Labels:
-
dashboards classic
-
management zones
- Mark as New
- Subscribe to RSS Feed
- Permalink
28 Feb 2022 11:28 AM
Hello @Afrezal_Karim
You can go through the below link to have an idea.
https://github.com/dynatrace-oss/DynatraceDashboardPowerups
Regards,
Babar
- Mark as New
- Subscribe to RSS Feed
- Permalink
28 Feb 2022 11:32 AM
Of course it's always a bit depended on whats the goal for the dashboards / which information management is interested in.
To make an overview Dashboard I'd probably keep it high level for management dashboards. Maybe include health tiles (honeycomb) and RUM data like User Sessions, Apdex etc, not to many low level metrics like disk usage.
You can also take a look at the BizOpsConfigurator to get some dashboard ideas.
With it you can create Dashboards in you Dynatrace Tenant with Templates from many different Github Repositories.
- Mark as New
- Subscribe to RSS Feed
- Permalink
02 Mar 2022 04:20 PM
Really depends on what you are wanting to show. We show VC of our top app, Active sessions, browser VCT, CPU but we are going to change soon.
BizOps configurator has some great views for exec management https://dynatrace.github.io/BizOpsConfigurator/#home
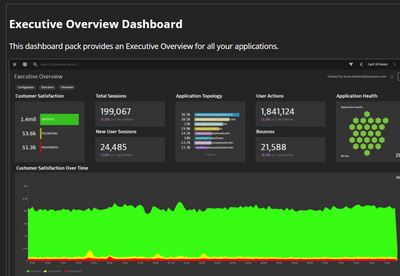
Example of one
Hope this helps
Featured Posts

