- Dynatrace Community
- Ask
- Dashboarding
- Dynatrace custom dashboard showing resource consumption process group OneAgent System Monitoring
- Subscribe to RSS Feed
- Mark Topic as New
- Mark Topic as Read
- Pin this Topic for Current User
- Printer Friendly Page
- Mark as New
- Subscribe to RSS Feed
- Permalink
24 Jan 2018
02:37 PM
- last edited on
06 May 2021
02:21 PM
by
![]() MaciejNeumann
MaciejNeumann
We would like to develop a custom Dynatrace dashboard showing the resource consumption of the process group OneAgent System Monitoring.
Option 1 was sharing the Process group dashboard of process group OneAgent system monitoring. This dashboard does not have the option Pin to dashboard.
Option 2 was setup a custom dashboard with multiple graphs showing resource usage of the OneAgent system monitoring. This is possible for the metric process-CPU, but not for the Metrics Memory usage, Worker processes, Process traffic.
This dashboard is mainly used in a UAT environment on which performance tests are executed on new releases before implementation on the production environment. The client wants to make sure that the configuration of the OneAgent and changes made in the configuration do not have a large impact on resources available.
Any ideas/suggestions?
Solved! Go to Solution.
- Labels:
-
dashboards classic
-
oneagent
-
process groups
- Mark as New
- Subscribe to RSS Feed
- Permalink
08 May 2020 12:10 AM
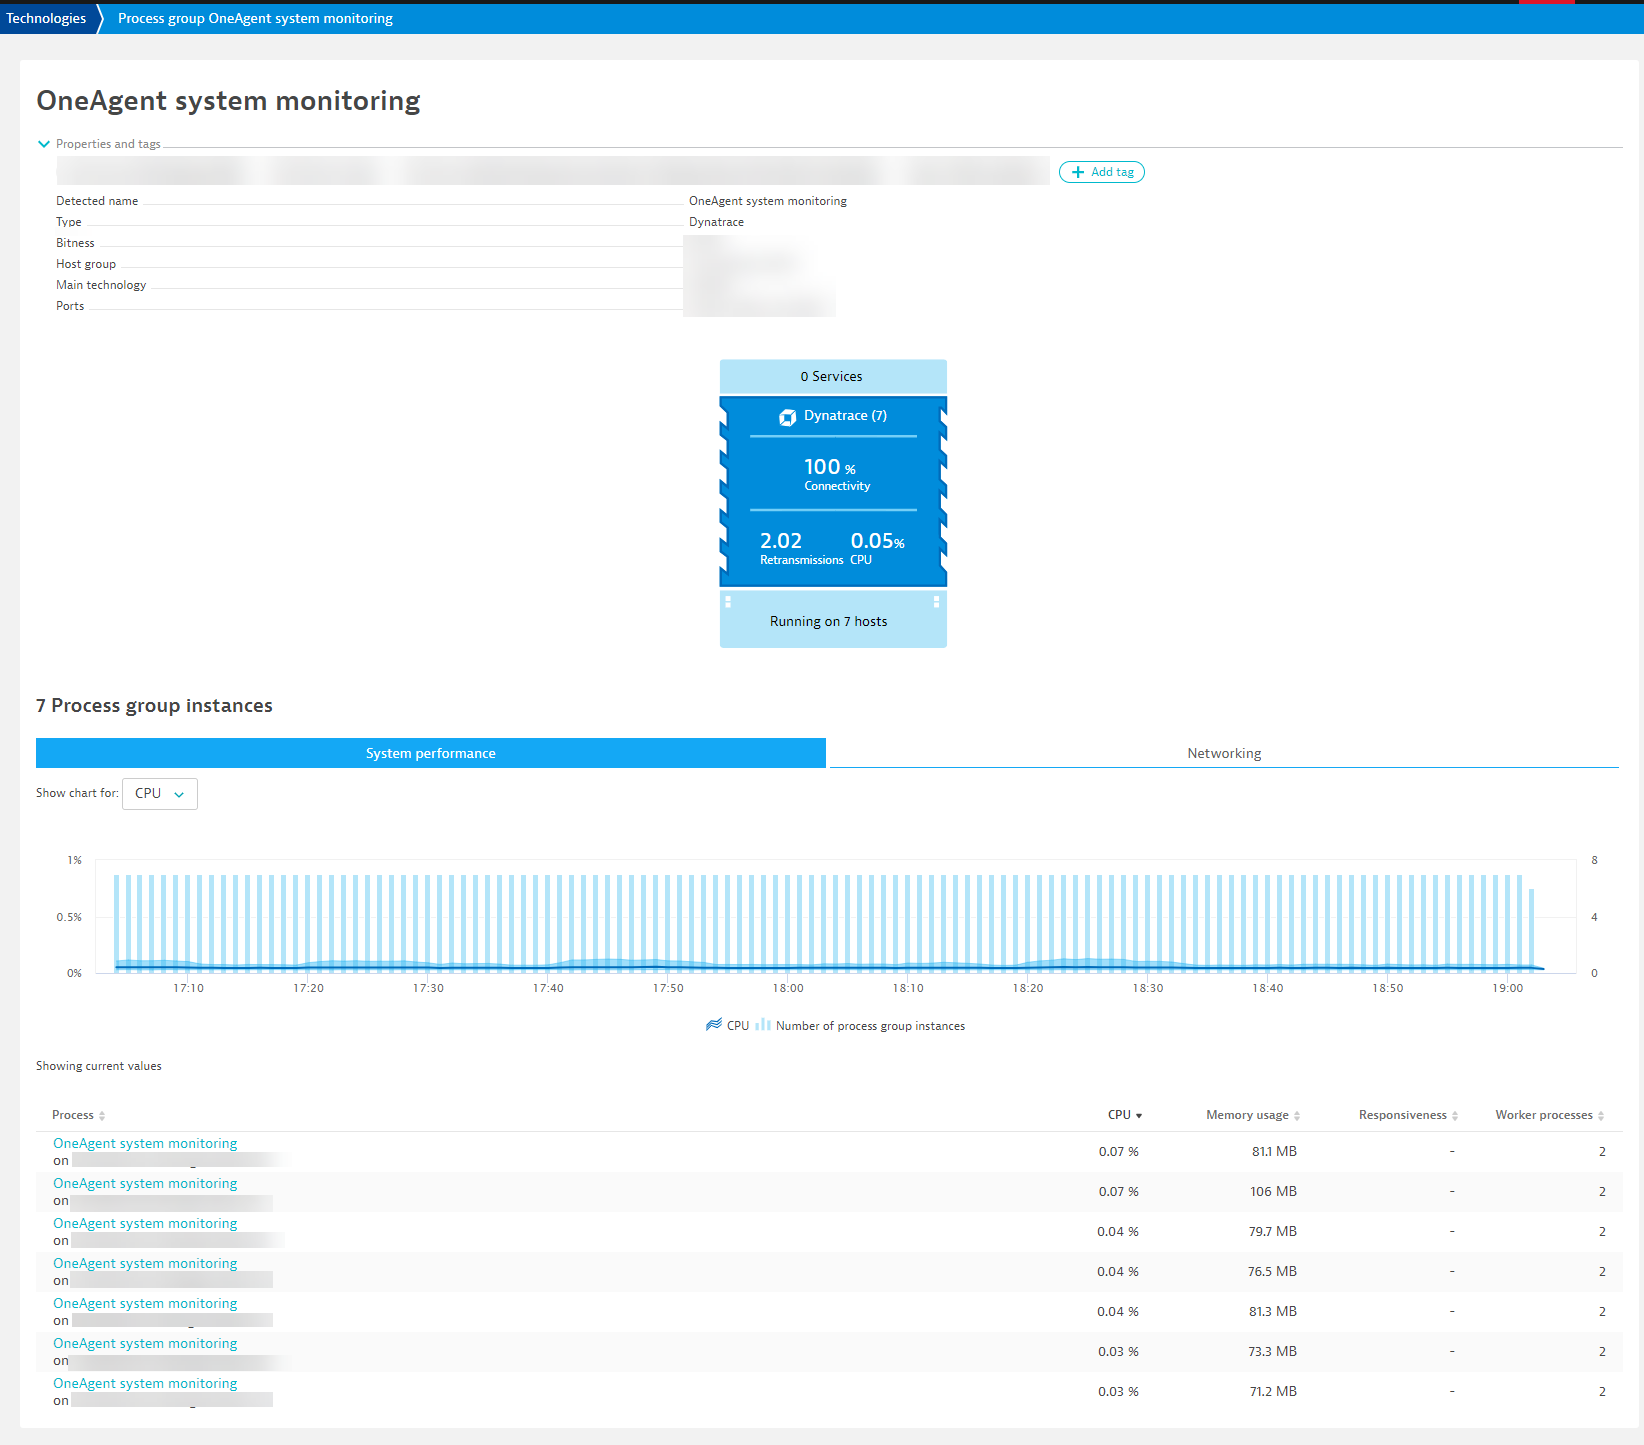
this is a really cool use case and we have a solution for this. I would recommend looking into creating the process grouping. This can be accessed via Settings> Processes and containers> Process group detection. From there you could create/modify a group to contain all the OneAgent system monitoring processes. Im not 100% sure if you could create a chart for the dashboard on this, but at least you will have a grouping that will give you the overall usage metrics.
Here is a small demo of what im talking about:

- Mark as New
- Subscribe to RSS Feed
- Permalink
08 May 2020 12:11 AM
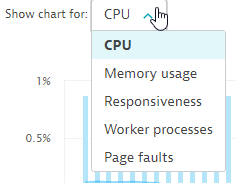
you can also change the metrics: 
- Mark as New
- Subscribe to RSS Feed
- Permalink
08 May 2020 12:18 AM
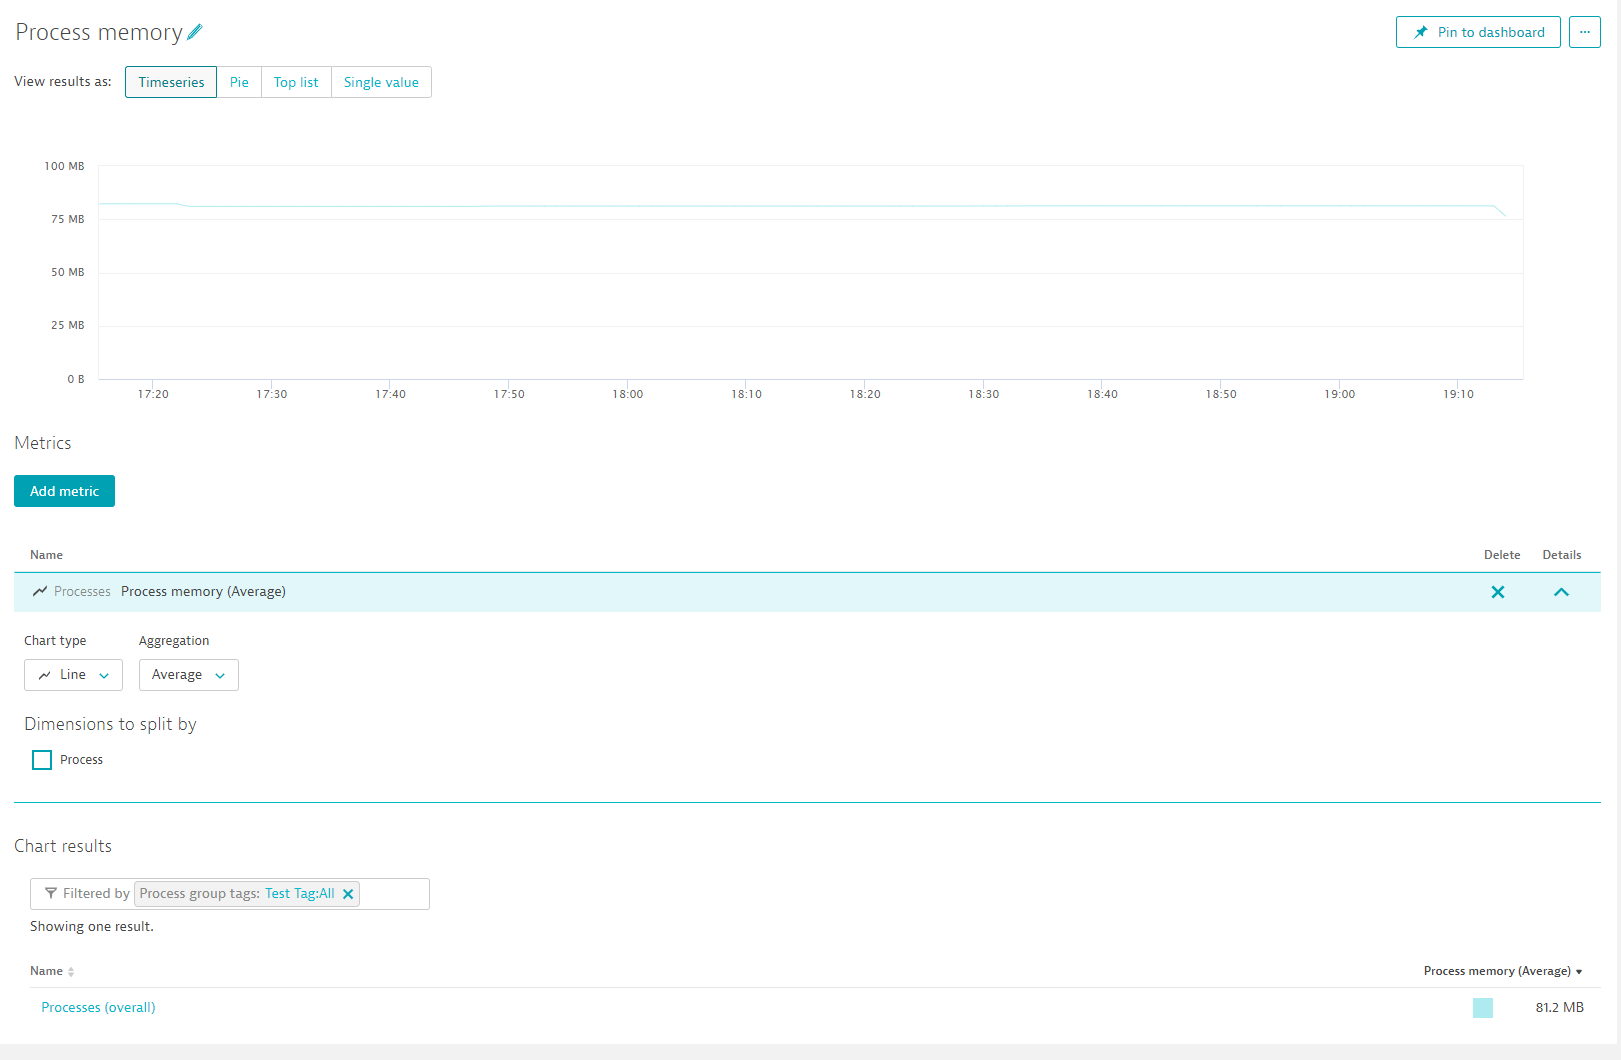
You can chart this, I was able to do so in this test example, First tag that new process grouping with a desired tag name (Test Tag for this example). Then select Technologies > Generic> Memory Usage and filter via that tag:

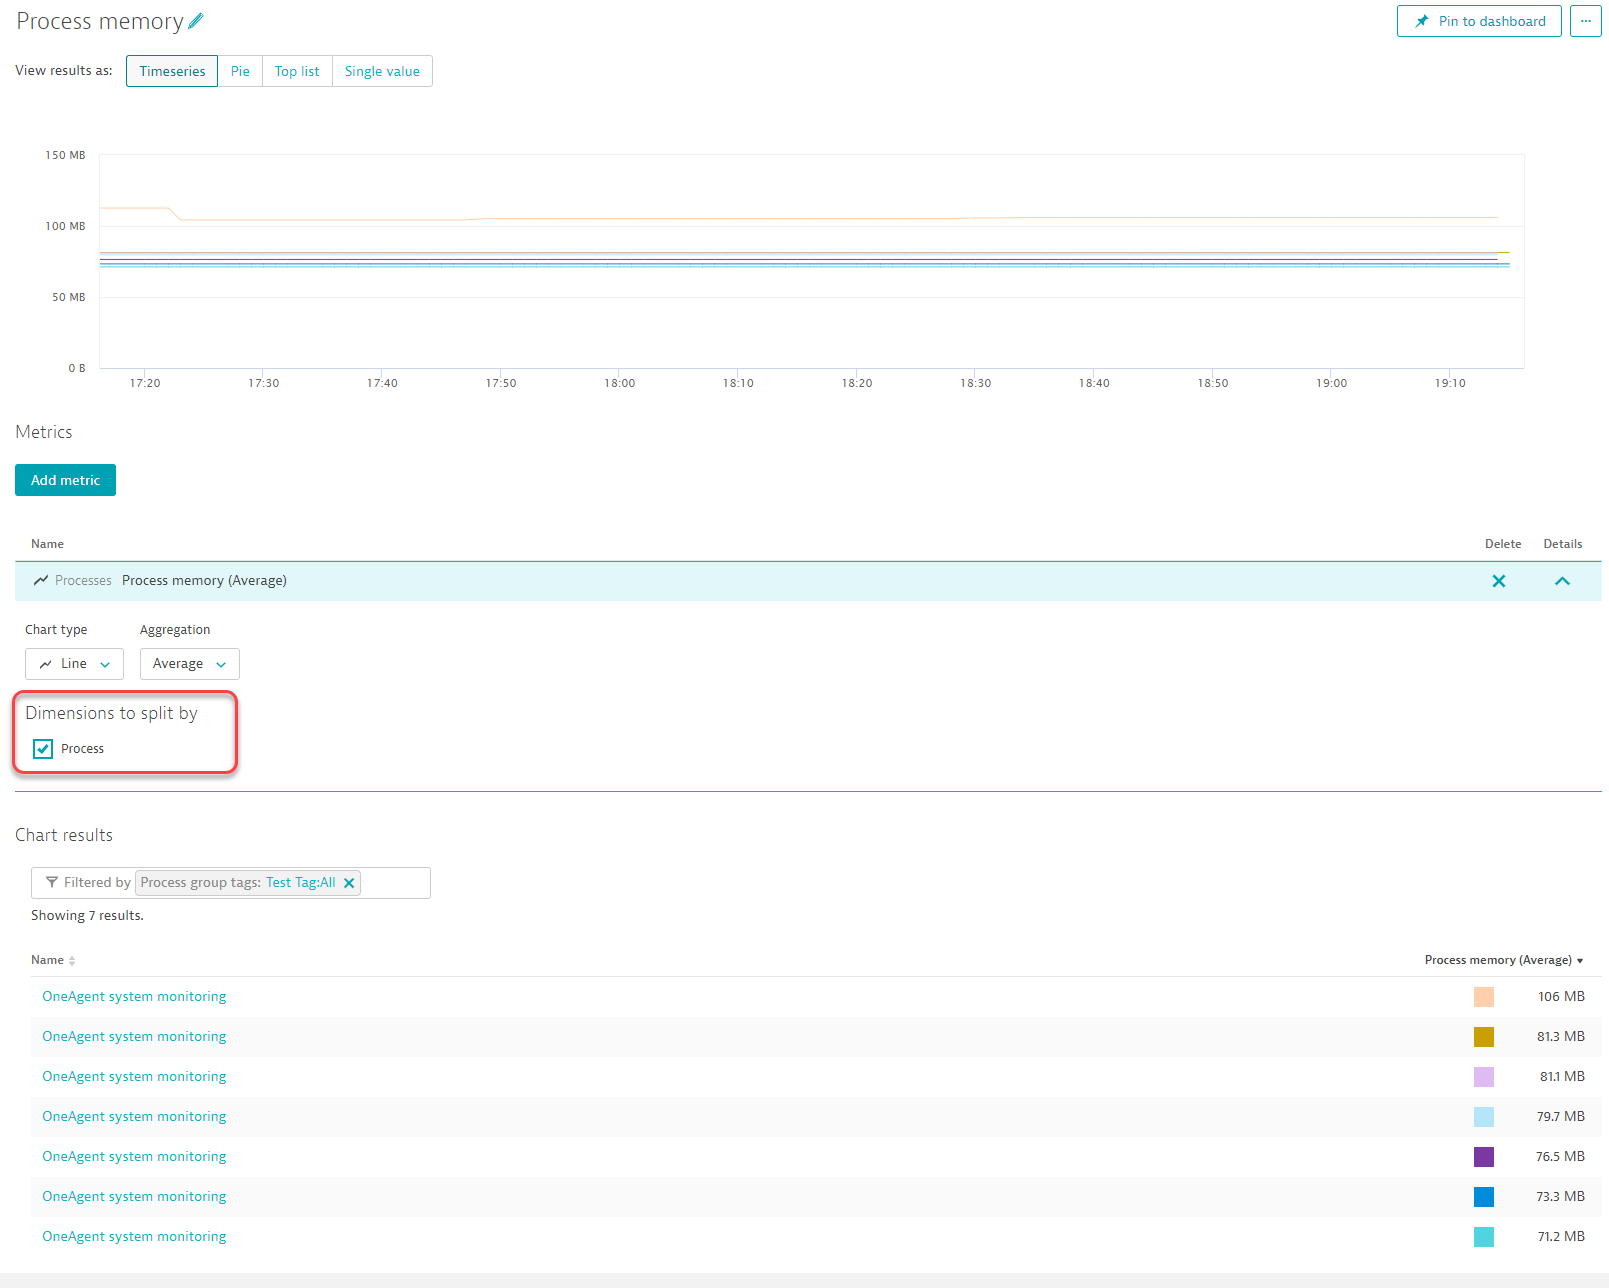
From there you can split our the processes too:

Featured Posts
