This website uses Cookies. Click Accept to agree to our website's cookie use as described in our Privacy Policy. Click Preferences to customize your cookie settings.
Dashboarding
Dynatrace dashboards, notebooks, and data explorer explained.
Turn on suggestions
Auto-suggest helps you quickly narrow down your search results by suggesting possible matches as you type.
- Community Home
- Platform
- Dashboarding
- Is it possible to see the performance data in a single graph instead of splitting in blue/green deployment?
Options
- Subscribe to RSS Feed
- Mark Topic as New
- Mark Topic as Read
- Pin this Topic for Current User
- Printer Friendly Page
Options
- Mark as New
- Subscribe to RSS Feed
- Permalink
22 Dec 2020
01:06 PM
- last edited on
10 Jun 2021
01:15 PM
by
![]() MaciejNeumann
MaciejNeumann
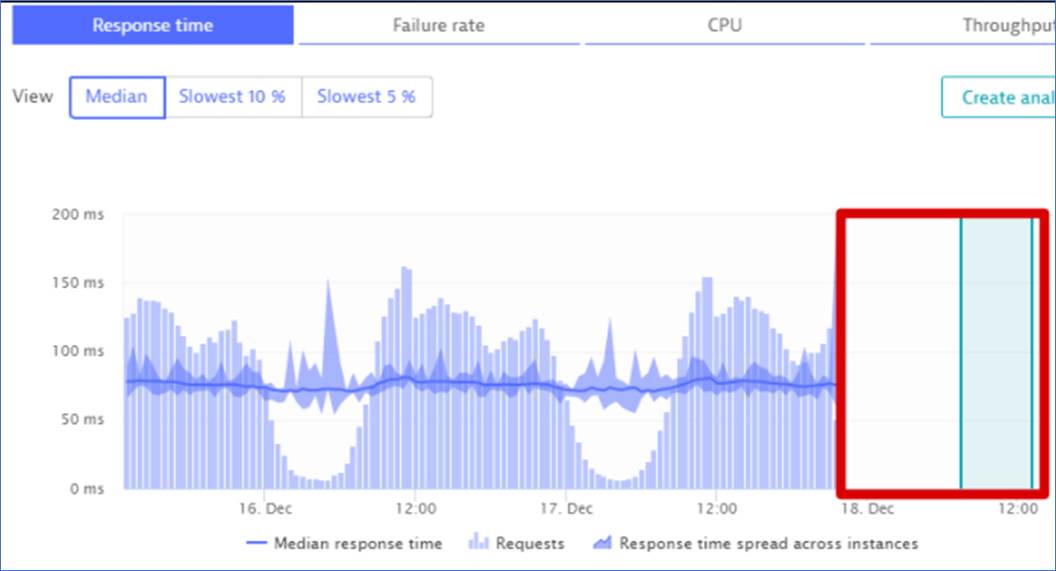
 Whenever we do Blue/Green deployment, AWS EC2 server is re-creating and all of the Dynatrace agent, applications are re-installing.
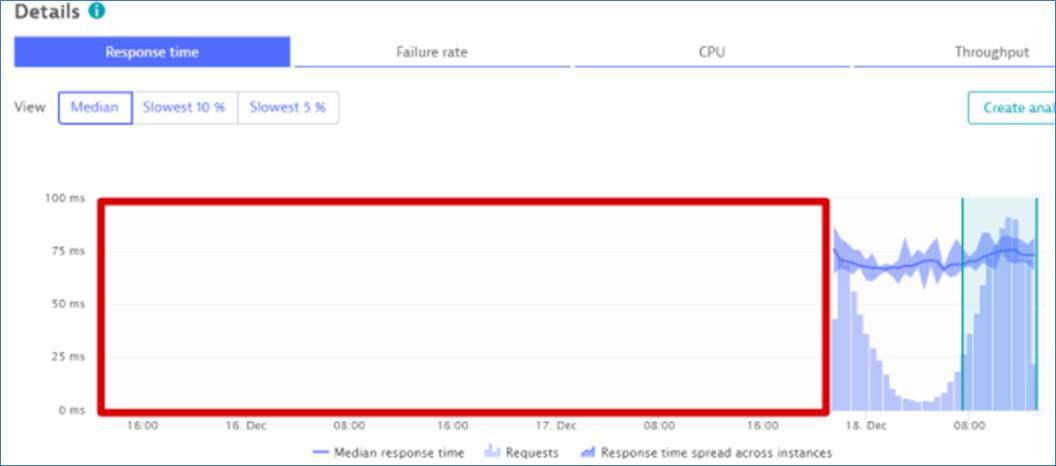
Even if we do Blue/Green deployment, the performance data should be displayed as single graph instead of splitting. Is it possible to do?
Please refer attached images to see the data which is splitted.
Solved! Go to Solution.
Labels:
- Labels:
-
aws
1 REPLY 1
Options
- Mark as New
- Subscribe to RSS Feed
- Permalink
23 Dec 2020 03:46 PM
Hi Peddireddi!
You may be facing a problem of split process group.
If the blue/green generates a new process group, then the services cannot be merged.
If that is the case, take a look here on how to Customize the structure of process groups.
If that is not the case, and the process group is always the same, then you can have some options at the service level, like:
Let me know if that suits you,
Regards,
PS.: You can also plot this data under custom chart, but that does not solve the problem. It only give you a better temporary visualization.
Featured Posts
