- Dynatrace Community
- Ask
- Dashboarding
- Is possible to create custom chart with request splitted by return code?
- Subscribe to RSS Feed
- Mark Topic as New
- Mark Topic as Read
- Pin this Topic for Current User
- Printer Friendly Page
- Mark as New
- Subscribe to RSS Feed
- Permalink
18 Jan 2019 04:21 PM
I would to create a chart with request from Nginx service splitted by HTTP return code but I'm not able to do this with Dyantrace OneAgent. Seems that only 4xx and 5xx are avaiable. Did you ever done something like this?
thanks a lot!
Solved! Go to Solution.
- Labels:
-
dashboards classic
-
services classic
- Mark as New
- Subscribe to RSS Feed
- Permalink
18 Jan 2019 04:38 PM
Hi Davide,
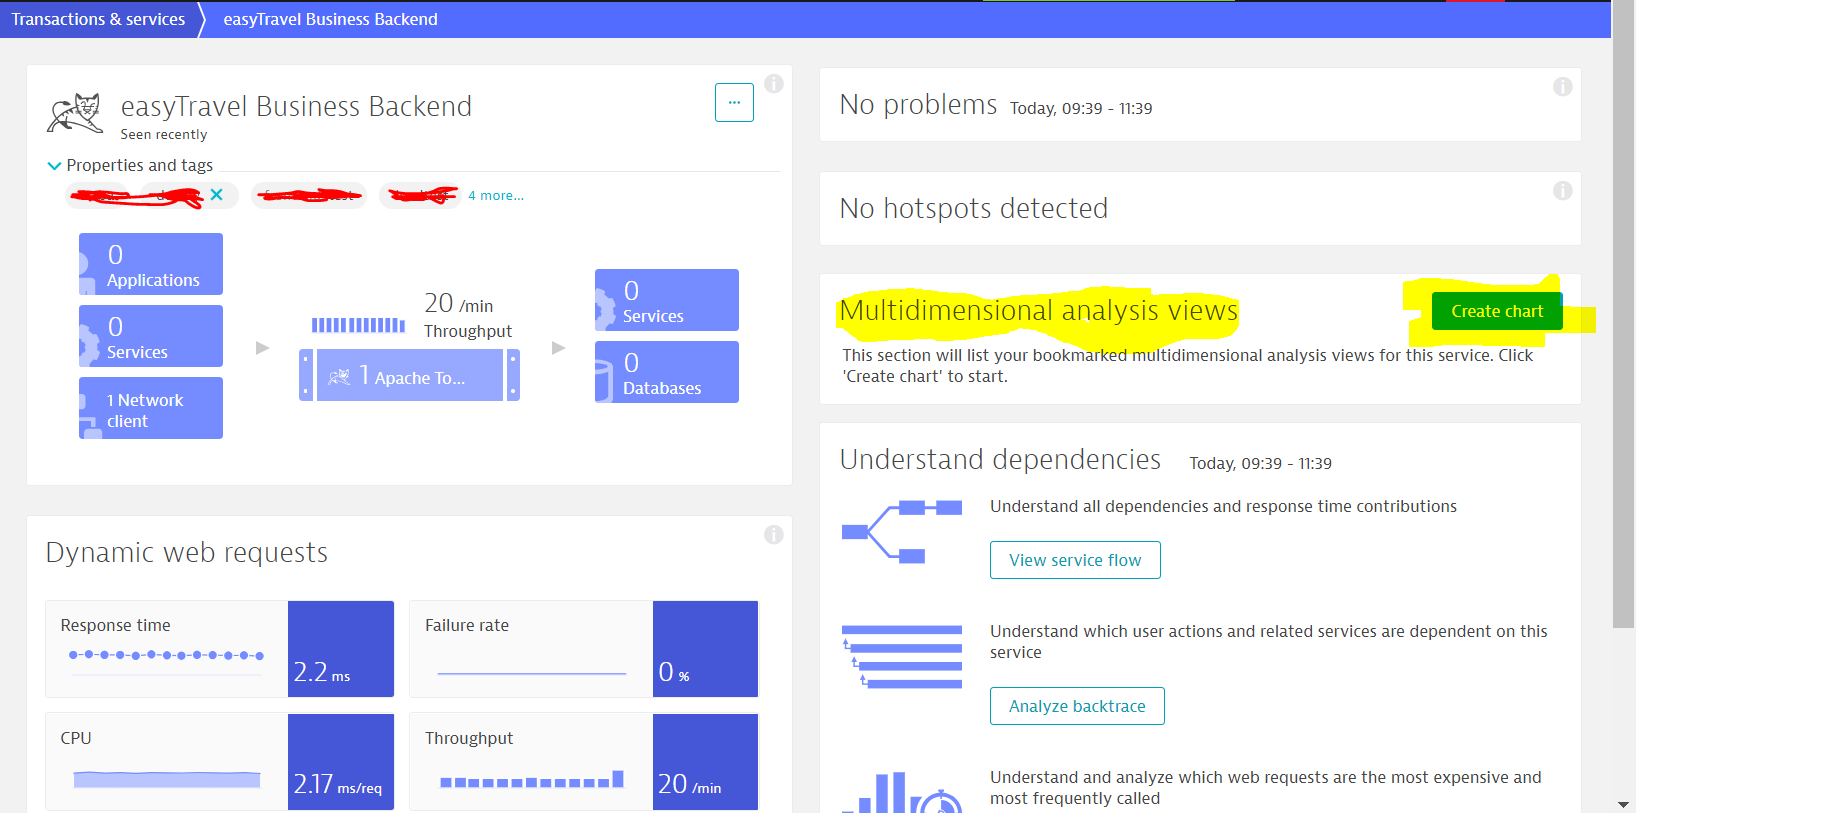
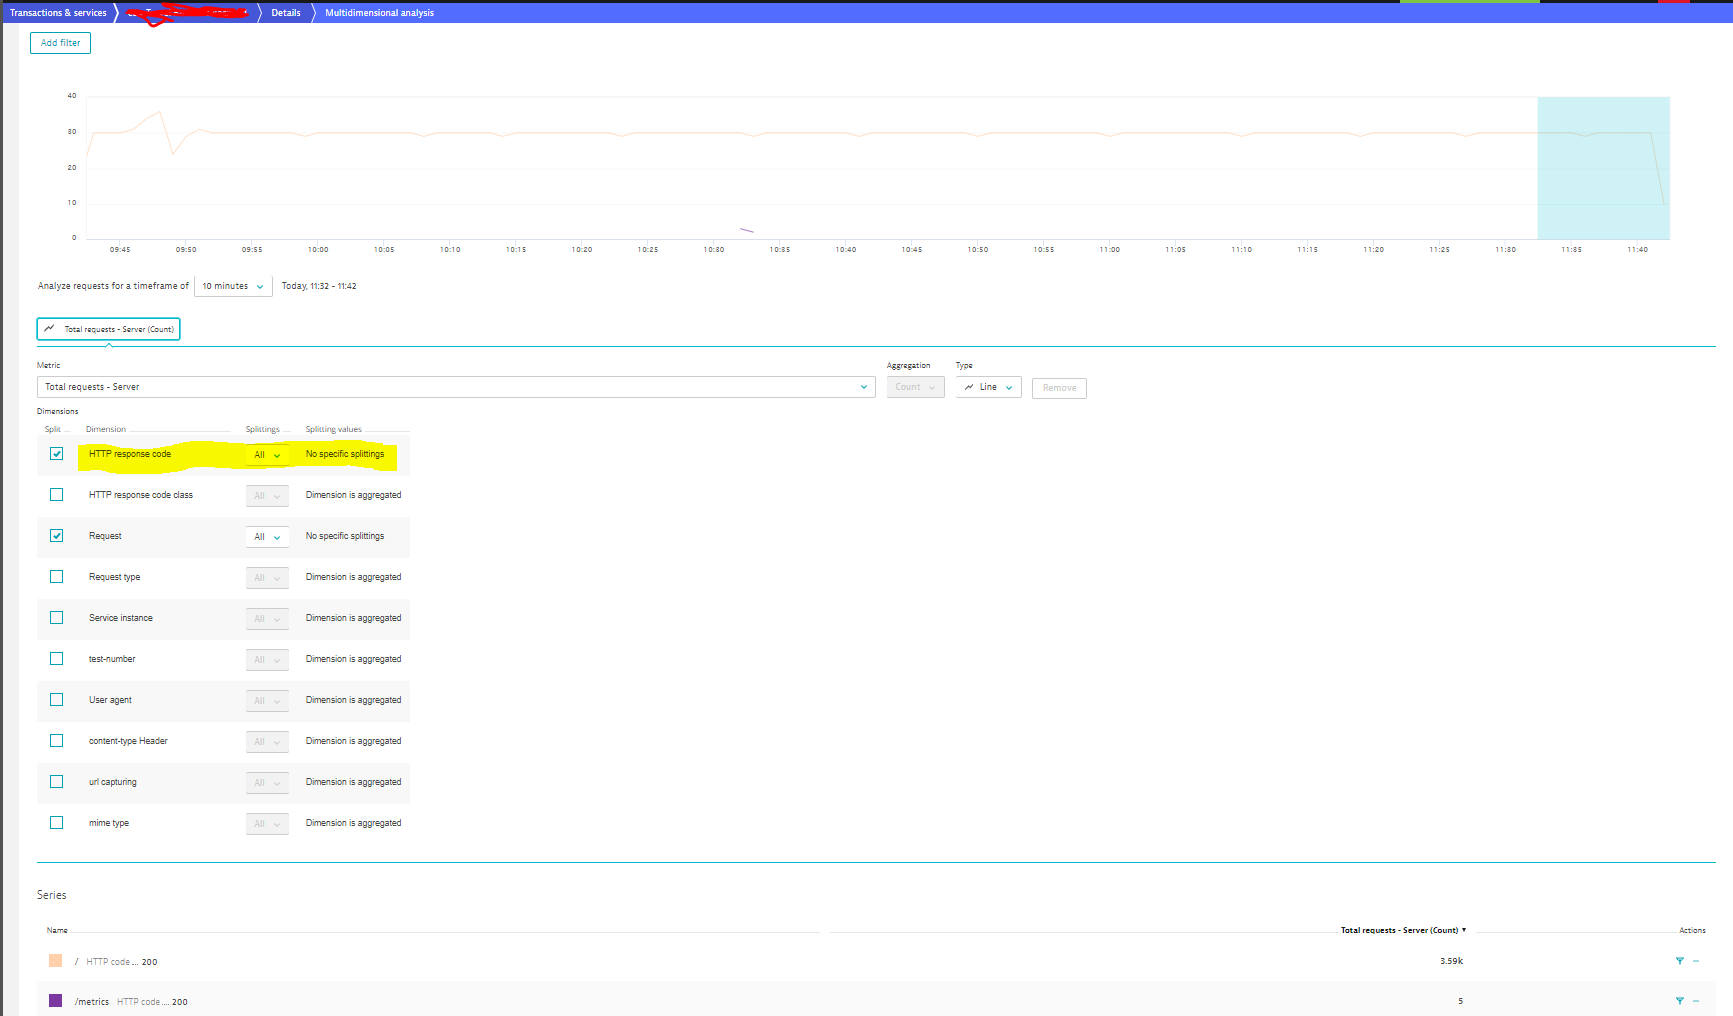
You can do this using the Multi-Dimensional Analysis for the Service. Go to the service page for this Nginx service in Dynatrace. At the right of the page, click on Create for "Multidimensional analysis views". Select the metric "Total request - Server" and in the dimensions below for this metric, check HTTP response code with Splittings of All. You can then save this to the service at the top right once it is complete. This should give you what you need. See screenshots below


Thanks
NJ
- Mark as New
- Subscribe to RSS Feed
- Permalink
18 Jan 2019 04:47 PM
Thanks a lot Ugochukwu! This works for me but unfortunately is not possible to add this chart on a dashboard.
- Mark as New
- Subscribe to RSS Feed
- Permalink
18 Jan 2019 05:02 PM
That is correct. Unfortunately it cannot be saved to a dashboard but you can save it to the service to view at anytime.
Thanks
NJ
Featured Posts
