- Dynatrace Community
- Ask
- Dashboarding
- Report all hosts with 7 days average CPU utilisation below "X"
- Subscribe to RSS Feed
- Mark Topic as New
- Mark Topic as Read
- Pin this Topic for Current User
- Printer Friendly Page
- Mark as New
- Subscribe to RSS Feed
- Permalink
14 Mar 2022
02:39 PM
- last edited on
25 May 2023
01:30 PM
by
![]() Michal_Gebacki
Michal_Gebacki
Hi all,
first time posting here. Very new to Dynatrace reporting and I need to provide the following in a table/list/report. All monitored hosts which have low processor utilization (for example below 15%) for the previous 7 days (we may want to widen this window to 14 days).
We need to be able to see the number of processors and/or cores in each host too (that would be ideal - but not essential).
The Reporting option didn't work for me as the table view didn't provide a 'slider' or a Page x of y - to display all results. Any other options would be great. As said, very new to the reporting/query side of Dynatrace so this might be a very simple answer to which Google search hasn't provided me any light at the end of the tunnel.
Thank you
Solved! Go to Solution.
- Labels:
-
cpu
-
dashboards classic
-
reports
- Mark as New
- Subscribe to RSS Feed
- Permalink
15 Mar 2022 08:47 PM
Hello @Phil-Luke-KTB ,
This sounds like a good case for our Data Explorer.
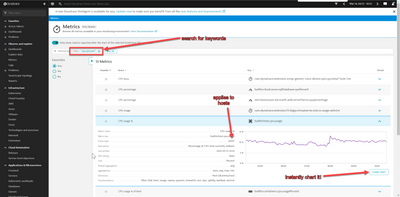
Before we start there, we can go to the left-hand menu and open "Observe and explore" > "Metrics" to see a comprehensive list of metrics in your environment.
I did a text filter search for "cpu percent" and found a CPU % metric that applies to Hosts. I then charted this metric.
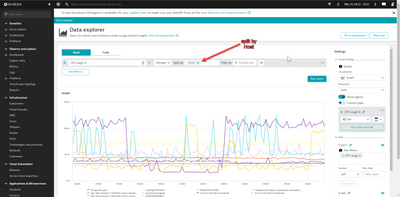
I then chose to split by Host
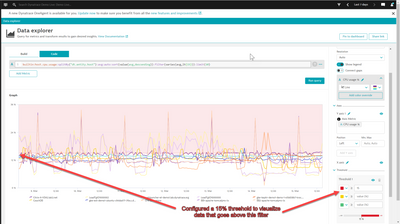
Your requirements included filtering for utilization < 15%, for example. Thankfully, the Data Explorer allows us to do anything that is possible through the Metrics API v2 - where we see specifically that we can do filtering on timeseries data.
To do so, let's click the "Code" tab button, and, following the rules of the API, we can add in our own filter (there should be some auto-complete to assist you).
In a graphical representation, you may notice data points that fall above 15% in this example. From our documentation for the filter:
Series condition
The series condition filters the time-aggregated value of the data points for a series by the provided criterion. That is, the specified aggregation is applied and then this single value result is compared to the reference value using the specified operator. For example, for series(avg, gt(10)), firstly the average over all data points of the series is calculated and, then, this value is checked to be greater than 10. If a series does not match this criterion, it is removed from the provided result. That is, the series operator cannot be used to filter individual data points of a series.
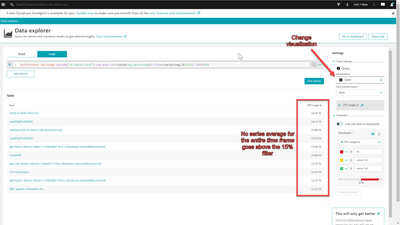
We will show series whose average over the entire time frame meets the filter criteria.
This can be shown if we change the visualization to "Table."
If you need to export this data, copying the text from the Code tab should essentially allow for plug-n-play in the Metrics API v2 - use this for the metricSelector parameter of your API call.
If you have any questions on any of this, I invite you to reach out to our Dynatrace ONE live support which can be accessed from directly inside your environment! One of our many Product Specialists will be happy to assist you with any of this in real time and answer any other questions you may have. 🙂
- Clyde | Dynatrace ONE
Featured Posts


