- Dynatrace Community
- Ask
- Dashboarding
- Request count fitered by host in the dashboard
- Subscribe to RSS Feed
- Mark Topic as New
- Mark Topic as Read
- Pin this Topic for Current User
- Printer Friendly Page
- Mark as New
- Subscribe to RSS Feed
- Permalink
21 Sep 2021
02:47 PM
- last edited on
31 May 2023
12:47 PM
by
![]() Michal_Gebacki
Michal_Gebacki
Hi all,
we've 1 service running in 4 processes (each process in their own machine), how can I put in a Dashboard service associated metrics (like response time (avg), number of HTTP errors, etc...) splited by process o host?
We want one tile for each process, for exemple, for the response time:
- Tile 1: Response time for service in machine 1
- Tile 2: Response time for service in machine 2
- ...
Regards, Josep Maria
Solved! Go to Solution.
- Mark as New
- Subscribe to RSS Feed
- Permalink
22 Sep 2021 07:02 PM
You will need to do this Via Tags.
First create a tag Called Host Name:{DetectedHostName} then the auto Tag will provide you a dynamic value. DO this for Hosts, Processes and Services and make sure you allow them to trickle down.
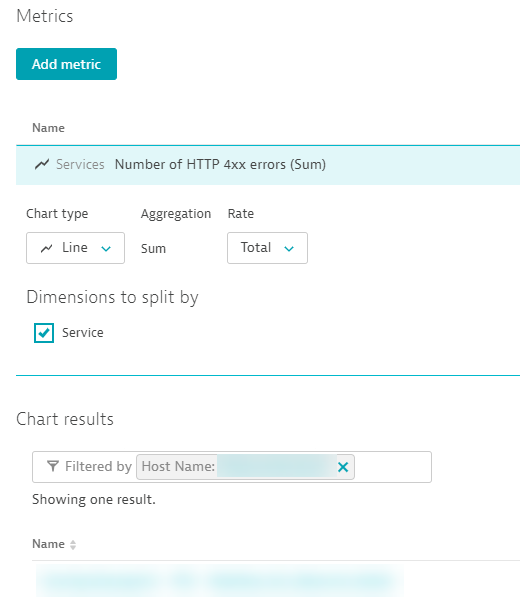
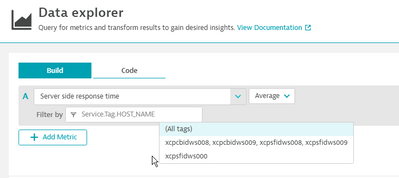
Once the tags are present then go to your custom charts - select your metric, then apply your filter:
- Mark as New
- Subscribe to RSS Feed
- Permalink
23 Sep 2021 07:45 AM
Hi,
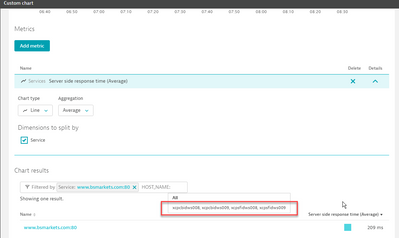
I have found the configuration of the chart but it seems that it will not help me since, as the service runs on all 4 servers, I cannot filter only by one:
I can't filter by only one host, right? I need to show in the DB the service response time for each host....
Regards! Josep Maria
- Mark as New
- Subscribe to RSS Feed
- Permalink
23 Sep 2021 01:00 PM
you should be able to filter one by one. Did you create the tag at the host level then, service level and then the process group level? You can also target the Host Group as well if they are unique to your host.
- Mark as New
- Subscribe to RSS Feed
- Permalink
23 Sep 2021 02:02 PM
Hi,
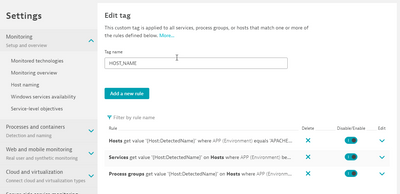
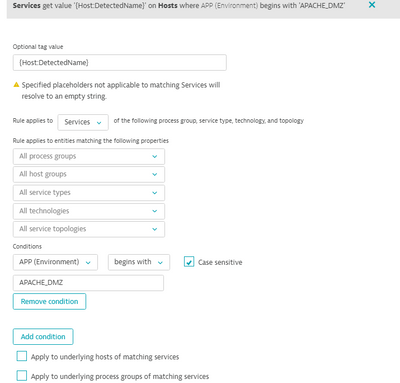
this is the TAG definition:
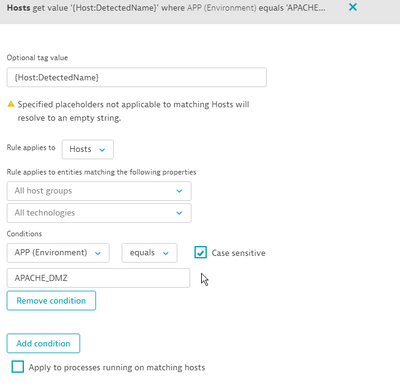
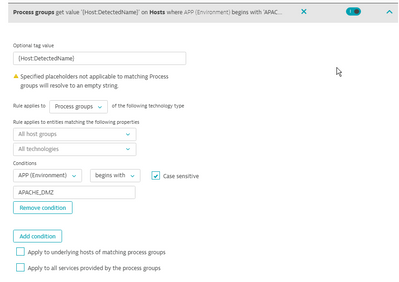
and each rule:
1.- Host
2.- Service
3.- Process Group
and with this isn't working:
Regards! Josep Maria
- Mark as New
- Subscribe to RSS Feed
- Permalink
23 Sep 2021 02:17 PM
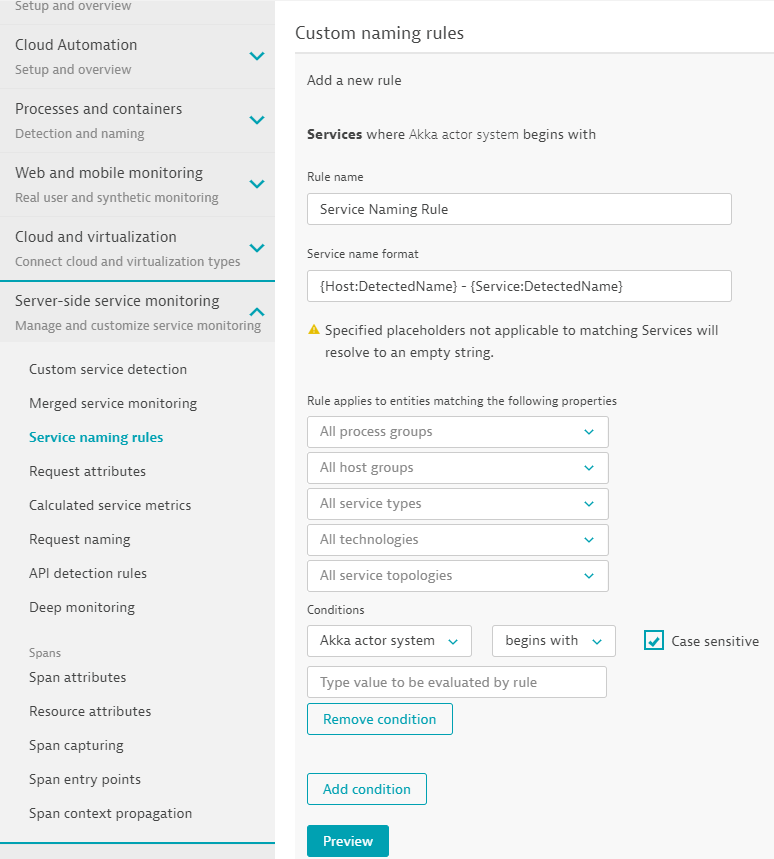
Thats correct. do the hosts have the same host group? Never the less you can also set up a Service Rename:
That would give you the value of Host1 - Security Scan. You could even toss this up and set it as Security Scan on Host 1. Because the service name is identical I think its all grouping it into one.
- Mark as New
- Subscribe to RSS Feed
- Permalink
23 Sep 2021 02:22 PM
Just looking at our set up, we have the Service Rename and the Tag for Host Name. And since the Service name is different across the hosts, the tag is a 1 to 1 ratio.
For Example you have 3 Hosts, all running Security Scan. Just as you have the tag set up, all 3 hosts have the same Service and service name of Security Scan running so its all lumped into one.
If we edit the service names by the Service Name Rules, you can make them unique by adding in a Host Name. So now the Service Name Becomes:
Host1 - Security Scan
Host2 - Security Scan
Host3 - Security Scan
But since the names are different, the tag of Host Name will only be that singular host.
- Mark as New
- Subscribe to RSS Feed
- Permalink
23 Sep 2021 02:39 PM
Hi Chad,
yes, this will work but we loose the "service aggregated view". I try to explain:
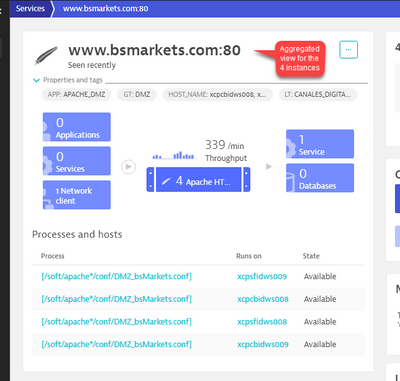
We have one unique service running in all 4 hosts, so, with this we have an aggregated view for the service and this is really useful for us:
So, without loosing the aggregated view, in several scenarios we need to "split" metrics by host and put the splitted value in our DB, like in multidimensional analysis:
Renaming the service implies loosing the aggregated view, right?
Regards and thanks for your time!!!
- Mark as New
- Subscribe to RSS Feed
- Permalink
23 Sep 2021 03:22 PM
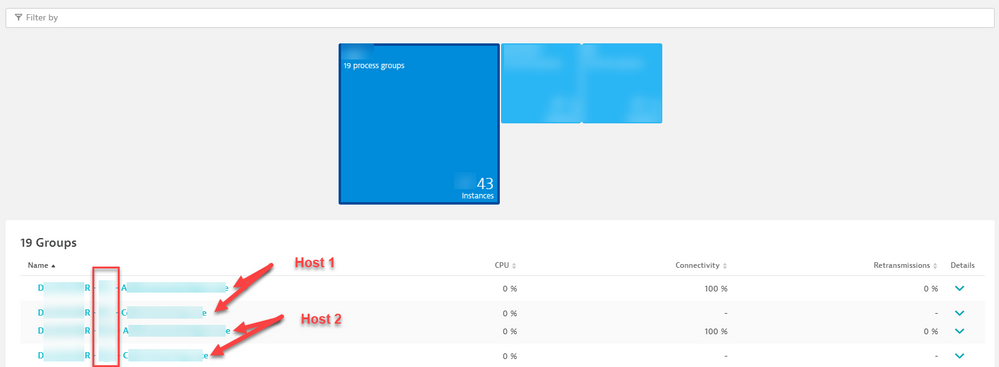
you are exactly right, even at a process group level:
The item in the Red box are the unique identifiers for the two processes/services on the 2 hosts, for a total of 4 individual items. This would also affect the Service groupings as such, But I wonder if you can merge them into eachother, while still retaining the unique names... Maybe Dynatrace Reps can shed some light on that or even test it in their demo environments.
- Mark as New
- Subscribe to RSS Feed
- Permalink
23 Sep 2021 03:30 PM
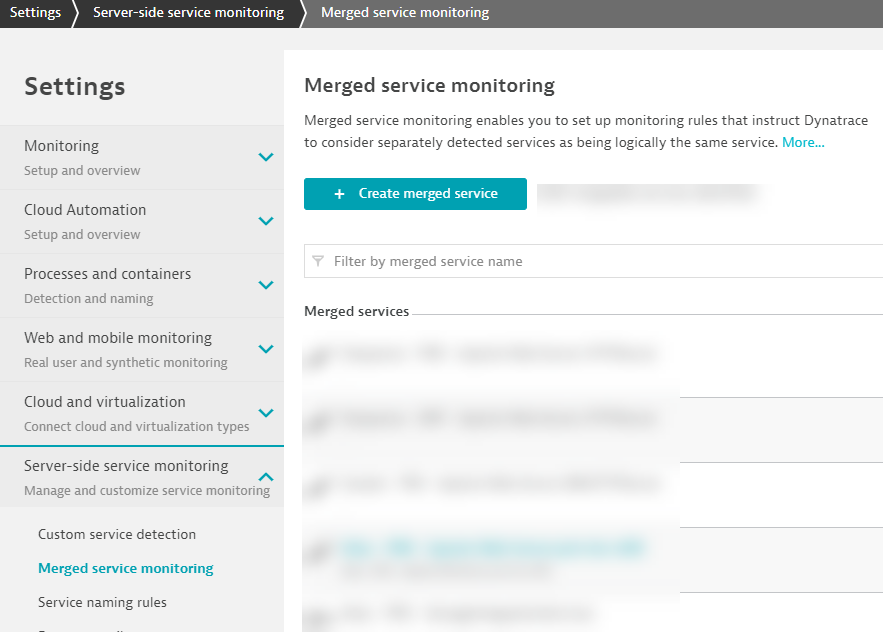
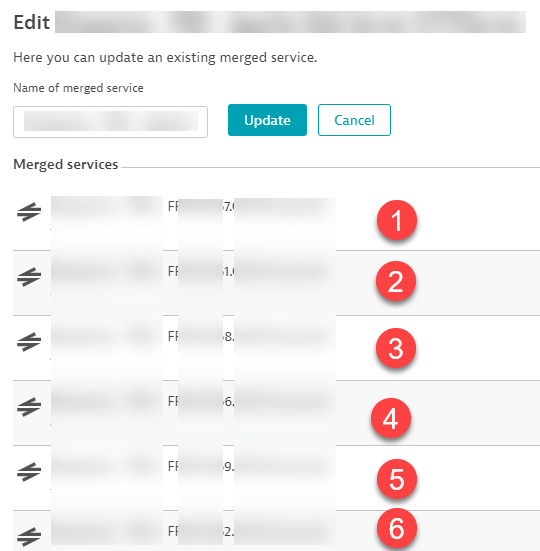
This would then allow you to add the groupings back together while still being unique:
Notice how we have 6 custom names but we are adding them as a merged service, but they still retain their custom name
- Mark as New
- Subscribe to RSS Feed
- Permalink
23 Sep 2021 01:05 PM
If that still isn't working in your set up, you can always rename your services via the Dynatrace settings. Much like tags you can set Dynamic Values. so Service name:{DetectedHostName} - {ServiceName} then the result will look like: Host1 - Security Scan. This will then allow you to filter out by service name and it will be clear as to the host each is part of.
- Mark as New
- Subscribe to RSS Feed
- Permalink
25 Sep 2021 10:52 AM
Hi @jcamps
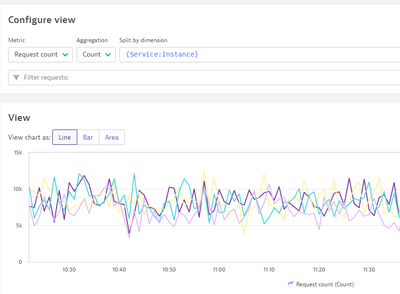
You can utilize MDA with splitting by {Service:Instance} for this
But since you still can not create a metric for this the only way we have found for show it on dashboard was to create links to the MDAs ![]()
There is an old RFE in New status for creating a metric split by instance ![]()
HTH
Yos
- Mark as New
- Subscribe to RSS Feed
- Permalink
27 Sep 2021 11:33 AM
Hi @Yosi_Neuman @ChadTurner ,
we will have to wait for the RFE to be implemented 😞
Thanks to both for the answers!
Regards!
- Mark as New
- Subscribe to RSS Feed
- Permalink
27 Sep 2021 03:30 PM
I do find it very disappointing that still the ability to show a Service split By {Service:Instance} is still not available in the Data Explorer or as a Calculated Metric. To me this is basic monitoring fundamentals. It was available and heavily used in AppMon but yet we're still waiting for this in OneAgent despite the RFEs.
Featured Posts
