- Dynatrace Community
- Ask
- Dashboarding
- Re: Threshold to table name
- Subscribe to RSS Feed
- Mark Topic as New
- Mark Topic as Read
- Pin this Topic for Current User
- Printer Friendly Page
- Mark as New
- Subscribe to RSS Feed
- Permalink
13 Oct 2022
09:34 AM
- last edited on
23 May 2023
02:45 PM
by
![]() Michal_Gebacki
Michal_Gebacki
Hi Team,
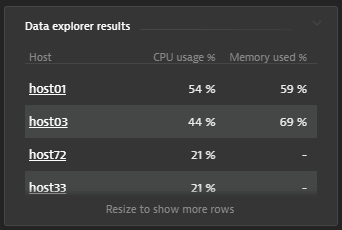
is there a way to change/set the threshold for the table content name? Please refer attached snapshot. In that, I need to set the threshold for the host column.
Solved! Go to Solution.
- Labels:
-
dashboards classic
-
data explorer
-
threshold
- Mark as New
- Subscribe to RSS Feed
- Permalink
13 Oct 2022 10:33 AM
What would you like to achive exactly? Would you like different thresholds on host level? Can you clarify this?
Best regards,
Mizső
- Mark as New
- Subscribe to RSS Feed
- Permalink
13 Oct 2022 11:27 AM
Your need is not clear,
What kind of threshold you want to put on host column?
- Mark as New
- Subscribe to RSS Feed
- Permalink
26 Oct 2022 10:34 AM
Hi Team,
I have attached the sample WebLogic process table which I need to achieve.
In table dashboard need to showcase process availability, process state(Running/Shutdown), port, Open Socket Count.
Till now I have achieved socket count and process availability.
- Mark as New
- Subscribe to RSS Feed
- Permalink
26 Oct 2022 11:19 AM
Hi @gauresh_shinde,
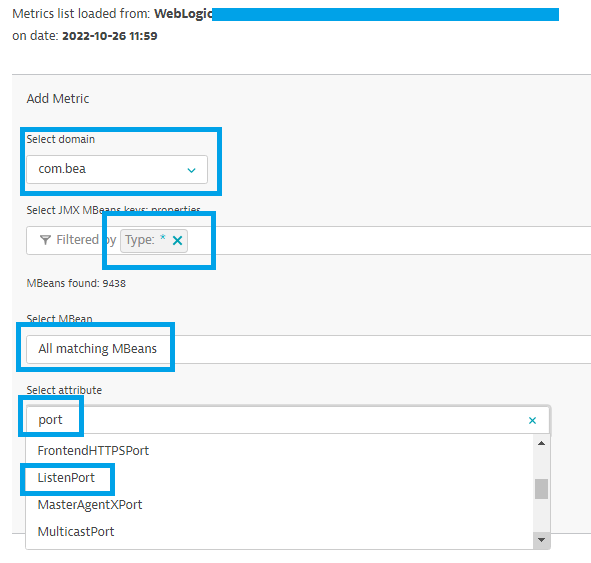
Regarding listen port try to add a jmx metric. You can brows for other jmx metrics too eg. some state metrics which can be meet your expectation regarding process state.
I hope it helps. Have a nice day.
Best regards,
Mizső
- Mark as New
- Subscribe to RSS Feed
- Permalink
26 Oct 2022 11:37 AM
Hi Mizső,
Thanks for the Information.
- Mark as New
- Subscribe to RSS Feed
- Permalink
26 Oct 2022 11:41 AM
Hi @gauresh_shinde,
You should chose unspecified instead of count as unit. Here is the result in data explorer:
Best regards,
Mizső
- Mark as New
- Subscribe to RSS Feed
- Permalink
26 Oct 2022 11:45 AM
Hi Mizső,
Yes, Already done.
Thanks for the information.
Best Regards,
Gauresh
- Mark as New
- Subscribe to RSS Feed
- Permalink
01 Nov 2022 10:58 AM
Hi Mizső,
We have enable the JMX extension but somehow we couldn't getting right metric for Listen Port. Not matching with actual value. For this do we have any other work around
Featured Posts


