- Dynatrace Community
- Ask
- Dynatrace API
- Re: API Breakdown in Dynatrace Managed
- Subscribe to RSS Feed
- Mark Topic as New
- Mark Topic as Read
- Pin this Topic for Current User
- Printer Friendly Page
- Mark as New
- Subscribe to RSS Feed
- Permalink
24 Mar 2022
02:30 PM
- last edited on
25 Mar 2022
09:23 AM
by
![]() MaciejNeumann
MaciejNeumann
In Dynatrace AppMon there was the "API Breakdown" which made a listing based on the defined APIs regarding Exec Avg, Exec Sum, Cpu Avg, Cput Total....
example:
Now I am looking for a similar view in Dynatrace Managed. I have also configured the "API detection rules" there under "Settings, Server-side service monitoring, API detection rules".
But now I cannot display these API detection rules as example in the "Multidimensional analysis".
For example the Metric CPU Time filtered of API detection rule:
We would like to find out, for example, how much CPU time an API configured under "API detection rule" has used. Does anyone of you have a solution here.
In the documetation the following is written:
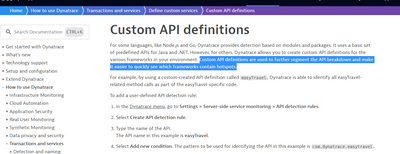
"Custom API definitions are used to further segment the API breakdown and make it easier to quickly see which frameworks contain hotspots."
However, I can't find anywhere an approach how to perform this API Breakdown.
Addition:
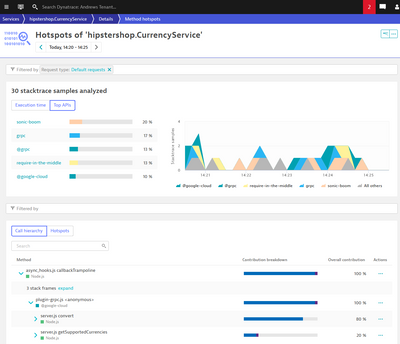
You can see the APIs in the Method hotspot, but unfortunately that's all. As far as I know, you can neither display the APIs on a dashboard (with Data Explorer) nor analyze the APIs directly (Multidimensional Analysis, split by Dimension API or use a Filter to a API itself).
Solved! Go to Solution.
- Labels:
-
dynatrace api
-
dynatrace managed
- Mark as New
- Subscribe to RSS Feed
- Permalink
01 Apr 2022 11:12 AM
Hi @urs_fischer,
the Dynatrace equivalent for the API Breakdown feature in Appmon would be the Method hotspots page. This can be found on a Serivce page under View dynamic requests (-> More) -> View method hotspots
Best,
Mark
- Mark as New
- Subscribe to RSS Feed
- Permalink
26 Apr 2022 03:23 PM
Thanks for your reply. This helps, but in tha past with AppMon i was able to use the API-stuff described above also for Dashboards and was also able to use it for breakdowns. Would great if i could use this also in Multidimensional analysis or on Dashboards.
Featured Posts


