- Dynatrace Community
- Ask
- Dynatrace API
- Response time distribution on Apache
- Subscribe to RSS Feed
- Mark Topic as New
- Mark Topic as Read
- Pin this Topic for Current User
- Printer Friendly Page
- Mark as New
- Subscribe to RSS Feed
- Permalink
21 Jan 2020
02:03 PM
- last edited on
25 May 2021
12:13 PM
by
![]() MaciejNeumann
MaciejNeumann
 Hi I have recently installed Dynatrace on one of my Apache node. One of my API is responding very slow causing the bad user experience and I am trying to get to the bottom of it.
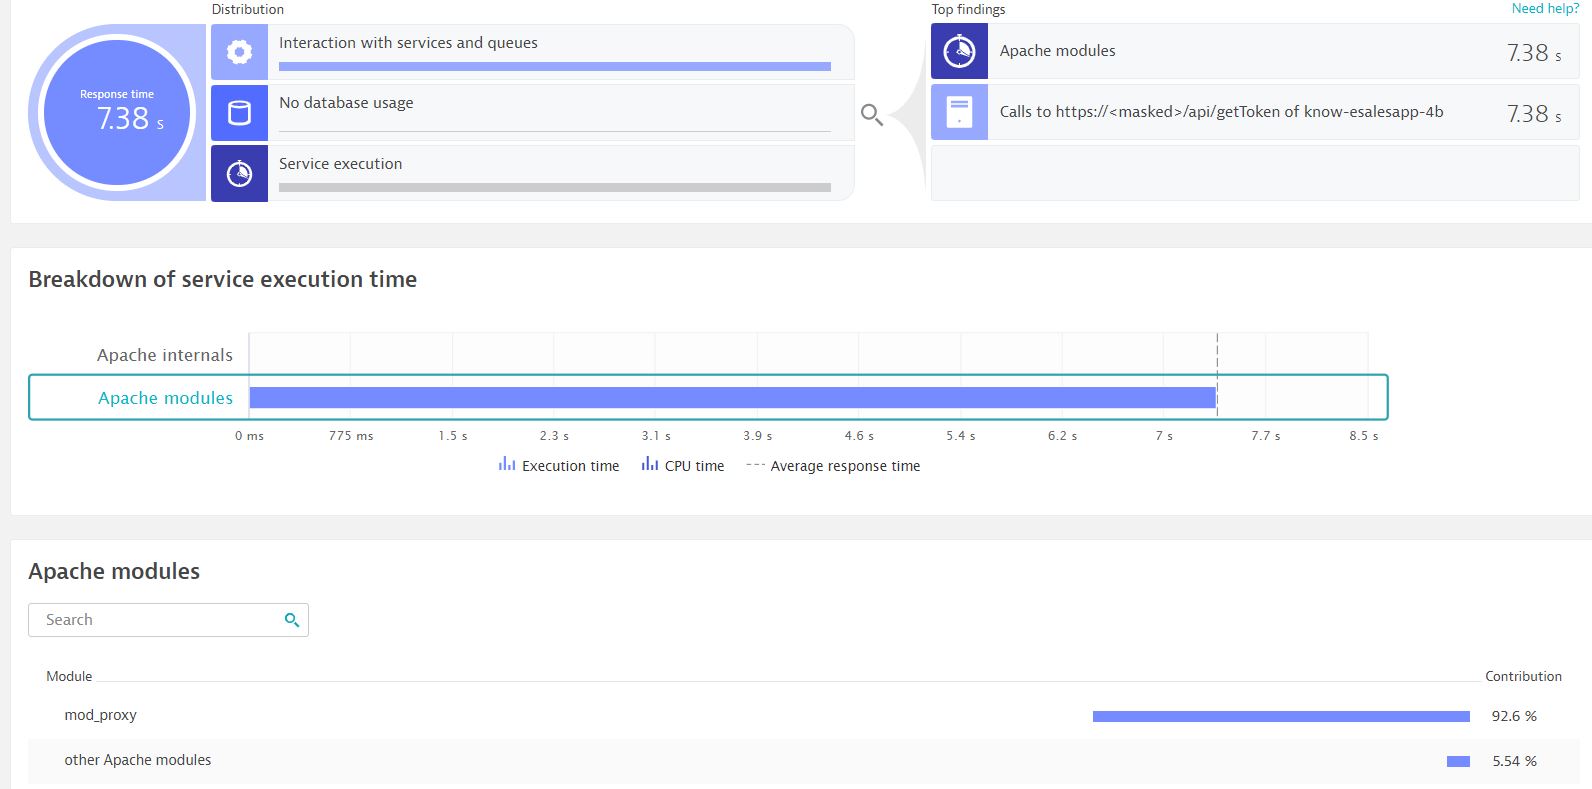
While analyzing when i select purepath, I see something like screenshot attached. In the section top findings it says the 7.8 seconds it is taking belongs to Apache Module and there is one more option.
When i click on apache Module it says 92.6% contribution from mod_proxy and nothing is available after that.
What does this mean? Does it indicates there is something wrong with my mod_proxy of Apache? If yes what is it? How do i find out?
Please guide me to dig a bit deeper to find out the cause. Appreciate any help
Solved! Go to Solution.
- Mark as New
- Subscribe to RSS Feed
- Permalink
21 Jan 2020 03:00 PM
have you checked name resolving on apache server ?
- Mark as New
- Subscribe to RSS Feed
- Permalink
21 Jan 2020 03:24 PM
@Rastislav D. Thanks for your response. I am sorry but what needs to be checked?
Can mod_proxy be responsible for performance issues? If you can elaborate that would be very helpful
- Mark as New
- Subscribe to RSS Feed
- Permalink
21 Jan 2020 04:17 PM
not sure what is your cause, but can check your apache config, look how your request is passed through and check if host names (if used) are resolvable.
- Mark as New
- Subscribe to RSS Feed
- Permalink
21 Jan 2020 07:40 PM
You have the answer right on the top right in the top findings section. It's not the apache as it is just proxying the communication but the proxied api (you have the right url there). The mod_proxy hotspot is just a result of the api itself. For the diagnosis, you have to analyze the hotspot at the called service.
Featured Posts
