- Dynatrace Community
- Ask
- Dynatrace Managed Q&A
- Dynatrace detecting exceptions not written to logs--> NoSuchBeanDefinitionException
- Subscribe to RSS Feed
- Mark Topic as New
- Mark Topic as Read
- Pin this Topic for Current User
- Printer Friendly Page
- Mark as New
- Subscribe to RSS Feed
- Permalink
01 May 2023
12:35 PM
- last edited on
20 Jun 2023
01:53 PM
by
![]() Karolina_Linda
Karolina_Linda
Hello
We have Dynatrace detecting exceptions that are not currently written to logs.
I am trying to best explain how Dynatrace is determining these exceptions exist since they are not
written to logs.
What would be the best way to describe how Dynatrace is picking up these exceptions?
Finally, what would be the best way to measure the impact of these exceptions?
Solved! Go to Solution.
- Labels:
-
dynatrace managed
-
oneagent
- Mark as New
- Subscribe to RSS Feed
- Permalink
01 May 2023 12:54 PM
Hi @runatyr,
I think Dynatrace detects the exceptions from code-level, you can dig into your code up to the method that had thrown the exception via code-level stacktrace.
- Mark as New
- Subscribe to RSS Feed
- Permalink
01 May 2023 01:14 PM
Is there an easy way to determine the impact the exceptions are having on the code execution?
What I mean by this is "what metric or measurement would show you how much the exceptions are impacting the code execution?"
I want to help eliminate anything that is affecting how well the code runs, but if these exceptions are not impactful, then I do not want to invest in the effort. For example, if I have an exception that gets seen 60,000 times in a minute across 10 servers. How would I see "the difference in performance" when that exception is eliminated?
Thank you so much !
- Mark as New
- Subscribe to RSS Feed
- Permalink
03 May 2023 08:27 AM
Hi @runatyr,
Exceptions are not always performance impacting, but any code run will use some resources.
You would have to compare apples to apples. Same Environment, same load, same actions happening before (with the exceptions) and after (once you change the code, so you get rid of that exception). - I would of liked to see a performance test run now (today) and again and then in Dynatrace you can use the compare feature or Data Explorer to compare metrics like CPU, Memory, Java specific metrics and service response times too etc.
For the mentioned exception: https://stackoverflow.com/questions/39173982/what-is-a-nosuchbeandefinitionexception-and-how-do-i-fi... - This might help you understand more about it.
- Mark as New
- Subscribe to RSS Feed
- Permalink
01 May 2023 01:29 PM
Hi @runatyr,
you can use the exception analysis via Multidimensional analysis, and validate the exceptions, There are situations in which the application code handles exceptions gracefully in a manner that isn’t automatically detected by Dynatrace. When this happens, Dynatrace doesn’t detect failed requests or alert you to errors. You can remedy such situations by specifying an exception class that should result in a failed request.
so you can add rules to ignore exceptions or add exceptions check Configure service failure detection
- Mark as New
- Subscribe to RSS Feed
- Permalink
01 May 2023 01:49 PM - edited 01 May 2023 01:53 PM
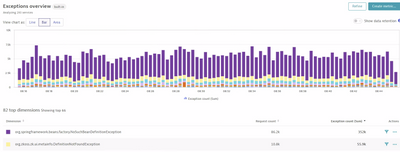
They say a picture is worth a thousand words, so here is an image to help illustrate my question.
We can see in this graph that we have for one type of exception alone. 352,000 instances in the last 30 minutes.
(The top purple alert--> org.springframework.beans.factory.NoSuchBeanDefinitionException)
What metric would I see improvement in if these were not present (CPU)??
My point is... What metric shows the impact of these exceptions?
If I can show the impact, then I can determine if fixing the code is a desirable use of resources.
Thank you so much!
Chris
- Mark as New
- Subscribe to RSS Feed
- Permalink
01 May 2023 02:00 PM
I got your point, I think it's not about the metric, you can go and check the distributed traces, and from the distributed traces check the details of this exception, if it occurs multiple times or makes suspensions or impacts CPU time, ..etc and also you can check the service backtrace.
and if you need to get more details about the exception itself you can google it, I'm doing that in some cases.
- Mark as New
- Subscribe to RSS Feed
- Permalink
01 May 2023 02:02 PM
Thank you, Mohamed. I agree with you. So you mentioned if it occurs multiple times (it does) how would i see if it is making suspensions or impacting CPU time? What screens would indicate this?
- Mark as New
- Subscribe to RSS Feed
- Permalink
01 May 2023 02:35 PM
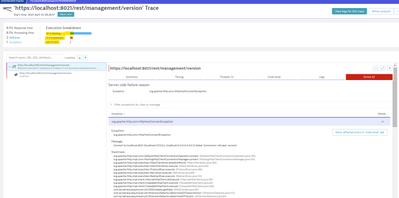
Thank you, Chris. it will be something like the below screenshot
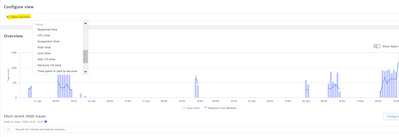
and you can filter from the distributed traces with response time or suspension time as well to get all requests based on your criteria,
also regarding the occurrence of this exception it might occur multiple times in a single user request or journey, so you can check that as well, if it's not clear in the current purepath you can check the service backtrace and try to see the traces of the calling service, then you will get all the details of the trace from a higher level.
- Mark as New
- Subscribe to RSS Feed
- Permalink
01 May 2023 02:49 PM
sorry, just forgot to mention that you can check the code level
and logs as well but make sure to check the prerequisites first before enabling OneAgent enrichment for logs features
Featured Posts


