- Dynatrace Community
- Ask
- Dynatrace Managed Q&A
- Re: How JVM memory utilization is monitored by Dynatrace?
- Subscribe to RSS Feed
- Mark Topic as New
- Mark Topic as Read
- Pin this Topic for Current User
- Printer Friendly Page
- Mark as New
- Subscribe to RSS Feed
- Permalink
30 Nov 2023 05:16 PM
Hi,
I want to know the details of How Dynatrace is monitoring the JVM utilization. Is it looking at the overall system process memory allocations or further introspection is in place? I could see JVM metrics but how are these values monitored or taken from the server.
These metrics are separate from the memory or CPU utilization. I could see that the amount of memory taken various processes like one agent or mysql service is not part of this visualization. I want to know how these values are appearing up and what configurations are made for this. How are the calculations done.
The version is 1.273.138.20230829-095340
Solved! Go to Solution.
- Labels:
-
dynatrace managed
-
oneagent
-
oneagentctl
- Mark as New
- Subscribe to RSS Feed
- Permalink
30 Nov 2023 06:57 PM
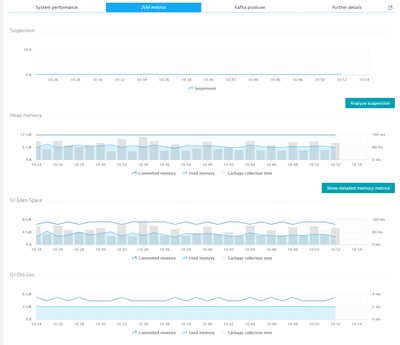
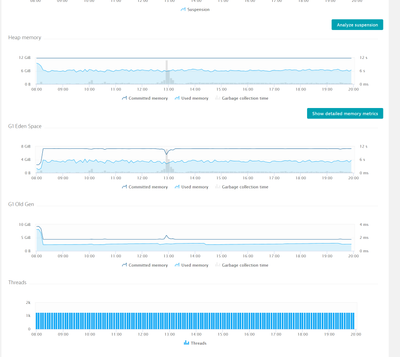
These JVM metrics are collected from the monitored Java processes using Dynatrace code module injected into the process and are using JVM Tool Interface to scrape them. These metrics are for the JVM process group instance you are looking at.
- Mark as New
- Subscribe to RSS Feed
- Permalink
30 Nov 2023 08:19 PM
How does these metrics are collected is there a configuration file? Please shed some light on the process how dtm is collected these metrics and also how or what calculations are being done. Thanks
- Mark as New
- Subscribe to RSS Feed
- Permalink
30 Nov 2023 11:36 PM - edited 30 Nov 2023 11:42 PM
I find this Java Book from Dynatrace might answer a lot of questions you might have:
https://www.dynatrace.com/resources/ebooks/javabook/performance-and-scalability/
- Mark as New
- Subscribe to RSS Feed
- Permalink
01 Dec 2023 10:05 PM
It is a good read, thanks for sharing it has helped me understand lot of concepts.
- Mark as New
- Subscribe to RSS Feed
- Permalink
01 Dec 2023 10:09 PM
I want to understand and know how dynatrace is practically configured and taking those details from the environment. I have the following concerns.
1- How JVM metrics are being monitored?
2- What calculations take place how it is reported.
3- How is the server's memory consumption monitored vs JVM consumption?
- Mark as New
- Subscribe to RSS Feed
- Permalink
02 Dec 2023 01:06 PM
Some of those questions don't have easy replies, as information on how Dynatrace does some of the "magic" is not publicly available. Anyway, here are some of my views:
- OneAgent loads agent code into the JVM process. It also uses JVM data sources to get JVM metrics. JMX is one of the possible data sources. It really also depends on the type of metrics being monitored. For JVM memory metrics, this link from the Java Book is a good one:
https://www.dynatrace.com/resources/ebooks/javabook/analyzing-java-memory/ - The JVM memory monitoring is pretty well described in the link above. Server memory should be obtained through the OneAgent os module. There are exceptions though, as in a Solaris environment.
- Mark as New
- Subscribe to RSS Feed
- Permalink
04 Dec 2023 07:31 PM
Hi @AntonioSousa I appreciate your response and keen interest. I wanted to understand the work logic behind it. Please try to explain or respond to my below concerns.
1- The link shared has all the information that mentions how jvm works and how the garbage collection takes place. It helped me learn Java objects and memory consumption. But no part of it mentions how all of this is monitored by Dynatrace. I searched the word Dynatrace and all the occurrences specified how all that JVM is monitored by a brilliant tool like Dynatrace. So the page does not contain any information that how JVM consumption is monitored by Dynatrace.
2- How come Dynatrace is gathering all the metrics from the server? By metrics, I'm specific to the JVM metrics.
If I run a top command on the server I see the following processes.
top - 14:23:19 up 22 days, 12:48, 1 user, load average: 5.34, 5.45, 5.50
Tasks: 256 total, 2 running, 254 sleeping, 0 stopped, 0 zombie
%Cpu(s): 24.1 us, 6.0 sy, 0.0 ni, 67.7 id, 0.9 wa, 0.0 hi, 1.4 si, 0.0 st
KiB Mem : 24679436 total, 203384 free, 18097288 used, 6378764 buff/cache
KiB Swap: 2097148 total, 0 free, 2097148 used. 6079224 avail Mem
PID USER PR NI VIRT RES SHR S %CPU %MEM TIME+ COMMAND
2471 gateway 20 0 22.7g 13.4g 23856 S 324.6 57.1 75665:29 java
1847 mysql 20 0 9477928 1.5g 10160 S 144.5 6.3 42150:25 mysqld
2025 dtuser 20 0 501868 210212 44632 S 24.9 0.9 5467:54 oneagentnetwork
1452 root 20 0 2407836 43080 7552 S 7.0 0.2 778:30.25 metricbeat
1471 root 20 0 1758292 92108 5308 S 3.0 0.4 346:44.36 filebeat
6 root 20 0 0 0 0 S 1.7 0.0 391:54.17 ksoftirqd/0
1675 fndsrv 20 0 10.9g 439292 22812 S 1.7 1.8 416:12.37 java
911 root 20 0 0 0 0 S 1.3 0.0 346:35.91 jbd2/dm-2-8
2095 layer7 20 0 12.9g 530564 19344 S 0.7 2.1 202:04.88 java
34216 root 20 0 1963048 15476 6156 S 0.7 0.1 35:02.95 filebeat
9 root 20 0 0 0 0 R 0.3 0.0 101:01.73 rcu_sched
1120 root 20 0 469136 4756 3872 S 0.3 0.0 91:43.35 NetworkManager
2029 dtuser 20 0 625676 26760 3644 S 0.3 0.1 26:25.88 oneagentplugin
So I know that dynatrace is actually monitoring the gateway process to report those metrics that I just pasted in a screenshot above. But how is it monitoring the gateway process? the process id of which is 2471
3- If we review your statement as you specified, OneAgent loads agent code into the JVM process. How does it do it? Is there a configuration file or a parameter that sets this up? It also uses JVM data sources to get JVM metrics. Where are these JVM data sources how dynatrace has been provided access to those data sources? JMX is one of the possible data sources.Where are these JMX data sources how dynatrace has been provided access to those data sources? Is JMX and JVM data sources different from each other?
Please help. @AntonioSousa @Julius_Loman
- Mark as New
- Subscribe to RSS Feed
- Permalink
04 Dec 2023
08:39 PM
- last edited on
01 Feb 2024
04:17 PM
by
![]() ghaydtner
ghaydtner
First of all, a little disclaimer: what I'm expressing here is not how it works, but how I feel it might work. Your questions involve knowledge that Dynatrace does not publicly disclose, and that might even be protected by things like patents (BTW, some of them make great readings).
In the past, with Dynatrace AppMon, and most of other APM solutions still today, if you wanted to instrument applications, like those involving Java, you would have to instrument them by hand, configure them as you hint, and after a lot of time, you would start getting some data. What Dynatrace did in that aspect was to automate this process, so when you run OneAgent on a server, it does it's magic by figuring out that a JVM is going to run, auto-instrumenting it from the start, and basically you don't need to do anything! Now, you do have some control on how this process works, but it's not even a Pareto 80/20 split. In my experience, it's like a 99/1 split, where you only have to get your hands dirty in very specific situations.
So, basically in your gateway process, when it started, Dynatrace injected it's Java agent. For most situations, that's why after installing OneAgent you need to restart the JVM for agent to be injected. And everything should go flawlessly after that!
How can you learn more about it? Specifically around the questions in number #3? Some hints below, but please remember that you shouldn't need to know anything of this, unless for some specific reasons (academic?), and also that these are public pointers, not any guarantee that this is how Dynatrace is doing it:
- Take a look at the Java APIs documentation, more specifically "Java Instrumention API", "Java Attach API", "JVM TI", etc. And combine that with known OS techniques (eg. LD_PRELOAD in Linux).
- The OpenTelemetry API also is a good way to find out how this is done. The OpenTelemetry eBook from Dynatrace is a good place to start: https://www.dynatrace.com/integrations/opentelemetry/
- If you are really, really, really into this, read the publicly available Dynatrace patents
Featured Posts


