This website uses Cookies. Click Accept to agree to our website's cookie use as described in our Privacy Policy. Click Preferences to customize your cookie settings.
Automations
All questions related to Workflow Automation, AutomationEngine, and EdgeConnect, as well as integrations with various tools.
Turn on suggestions
Auto-suggest helps you quickly narrow down your search results by suggesting possible matches as you type.
- Community Home
- Platform
- Automations
- Defining an SLO for KeyRequest response time
Options
- Subscribe to RSS Feed
- Mark Topic as New
- Mark Topic as Read
- Pin this Topic for Current User
- Printer Friendly Page
Options
- Mark as New
- Subscribe to RSS Feed
- Permalink
14 Jun 2022 10:25 PM
I'm trying to create an SLO definition based on the number of fast and slow key requests, WITHOUT the need to create a custom metric for slow requests.
My idea was to define the SLO as:
100* (number of slow key requests / number of total requests)
nothing special, really.
I could create a custom service metric for the keyrequest that counts the number of requests that exceed a certain response time. But could this be done without that step, just with metric queries?
I thought of this metric query:
builtin:service.keyRequest.response.time
:filter(
  <filter for my key request goes here>
)
:avg
:partition(
 "time",
 value(fast,lt(300000)),
 value(slow,otherwise)
)
:splitBy("time")
:filter(eq("time","fast"))
:count
:fold(sum)
The idea was to use partition as a way to get the metric data points above and below a certain slow/fast level and then use count to calculate the number of datapoints and use those in the SLO definition: 100*(slow/fast).
(it wouldn't be perfectly accurate due to aggregation, but it should work for the SLO)
The metric partitioning works:

but I'm struggling in "counting" the number of metric points required for the SLO calculation.
Any ideas how this could be achieved?
Certified Dynatrace Master, Dynatrace Partner - 360Performance.net
Solved! Go to Solution.
Reply
10 REPLIES 10
Options
- Mark as New
- Subscribe to RSS Feed
- Permalink
15 Jun 2022 06:52 AM
Thankyou @r_weber for this post, I dont have any solution yet but due to your post came across these below blogs which helped me to understand the SLO integration much better 😉
Example configuration of service-level objective definitions | Dynatrace Docs
SLOs at Scale: Tips and Tricks | Dynatrace news
7 steps to identify and implement effective SLOs | Dynatrace news
KG
Options
- Mark as New
- Subscribe to RSS Feed
- Permalink
23 Sep 2022 07:54 AM
Hello @r_weber and thank you because your post pointed me in the right direction.
I was struggling too because even with partitioning, if I divided by the count of all the response times I always got 100%, this because with aggregation every dot is considered 1 event.
By using partition and fold(sum) like you did we get the number of occurrences of each partition in the selected time frame, then by using fold(sum) on all the events we get the number of total events in the same timeframe and then we can calculate how many time it was good in a % way.
I did it like this:
(
    builtin:service.keyRequest.response.time
    :filter(
        <filter for my key request goes here>
    )
    :avg
    :partition(
        "time",
        value(fast,lt(300000)),
        value(slow,otherwise)
    )
    :splitBy("time")
    :filter(eq("time","fast"))
    :count
    :fold(sum)

    /

    builtin:service.keyRequest.response.time
    :filter(
        <filter for my key request goes here>
    )
    :avg
    :splitBy()
    :count
    :fold(sum)
) * 100
I hope this is helpful 🙂
Alessandro
Reply
Options
- Mark as New
- Subscribe to RSS Feed
- Permalink
28 Sep 2022 03:01 AM
Hi @AlessandroG , did you manage to set SLO with your query? as I can see this is working in Data Explorer however I couldn't make it work in SLO.
Reply
Options
- Mark as New
- Subscribe to RSS Feed
- Permalink
28 Sep 2022 03:05 AM
Would be great if you could help us show an example how did you achieve in SLO wizard 🙏
Options
- Mark as New
- Subscribe to RSS Feed
- Permalink
29 Sep 2022 08:02 AM
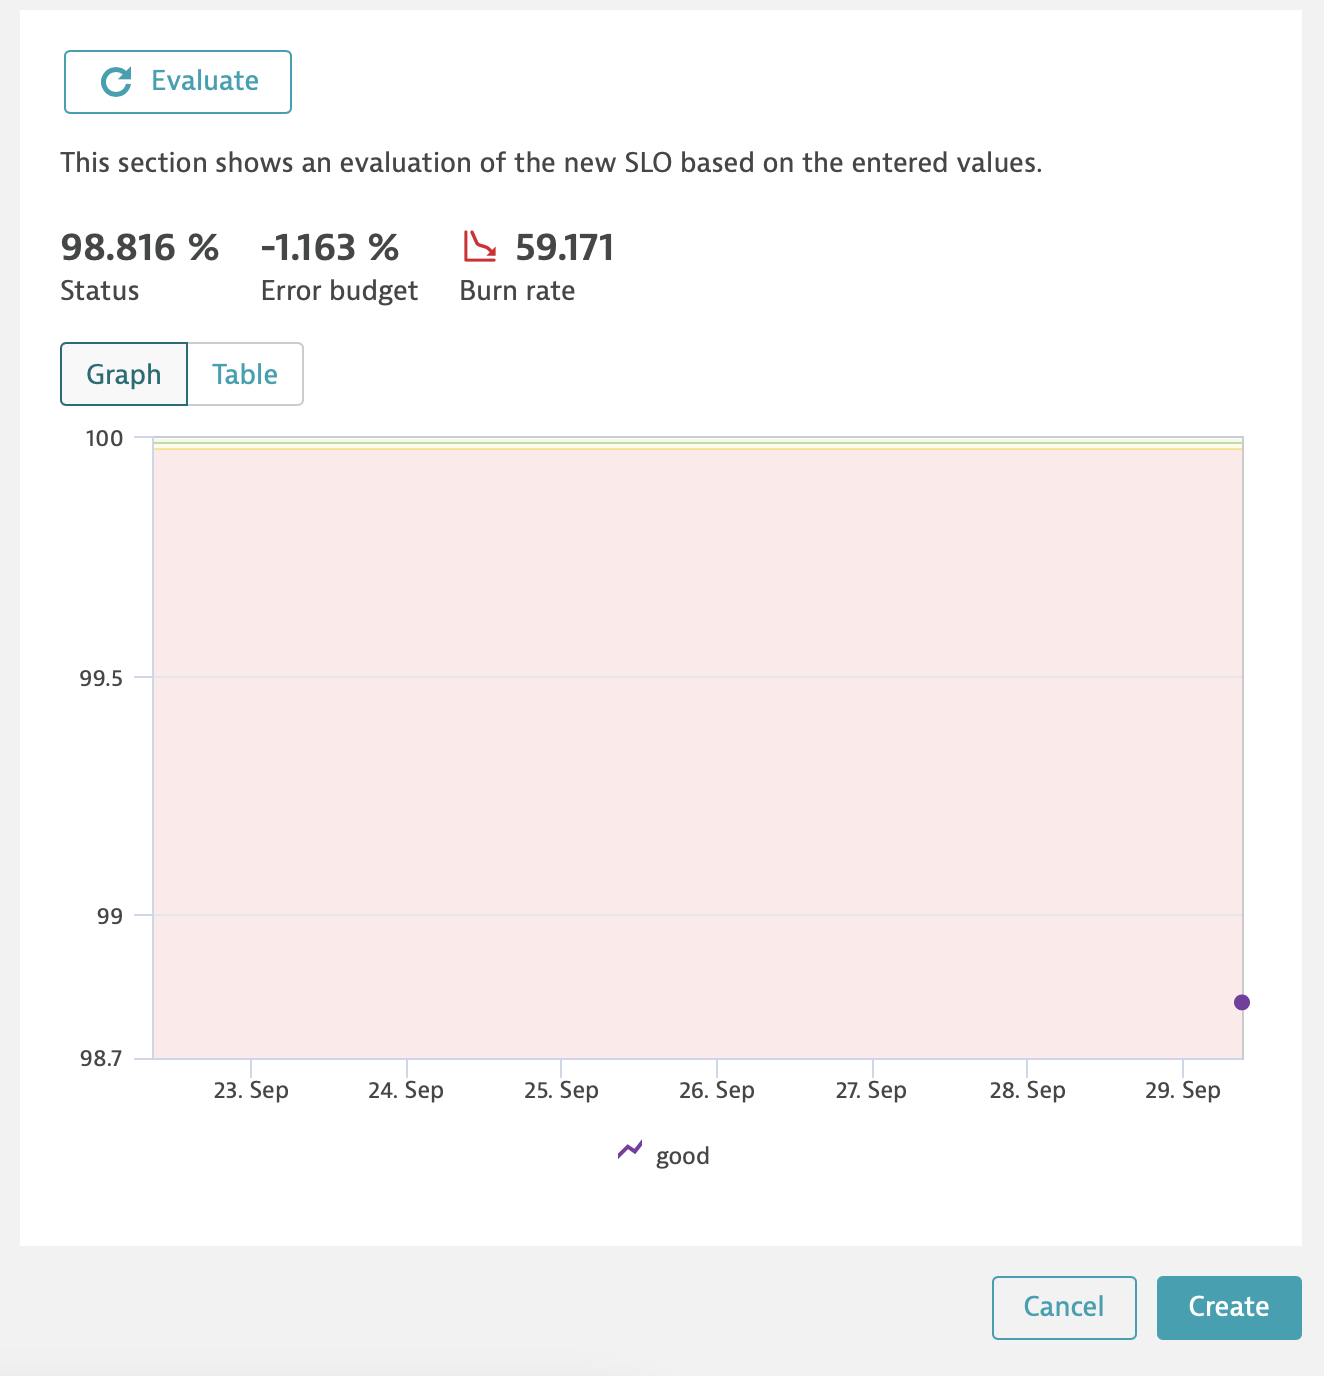
At the moment I can't post an example with a KeyRequest because the ones I have are tests and are not called enough times to get a result out of them.
I've attached an example using a service response time and will add one with a service key request response time as soon as I get enough data for it 🙂
Which error do you get when trying to get the SLO?
So far I saw that to use service.keyRequest.response.time you need to use type("SERVICE_METHOD") in the filter and then the name or the id of that key request.
Also you don't need to add the filter in the query of the SLO because you can do it in the filter section.
Options
- Mark as New
- Subscribe to RSS Feed
- Permalink
28 Sep 2022 05:05 PM
Using avg+partition has no reason in this case, since you can simple filter aggregations like this:
(100)*(builtin:apps.web.action.visuallyComplete.load.browser:filter(series(percentile(75),lt(10000))):splitBy():count)/
(builtin:apps.web.action.visuallyComplete.load.browser:splitBy():count)
It doesn't solve initial problem - filter by criteria without aggregation.
Options
- Mark as New
- Subscribe to RSS Feed
- Permalink
29 Sep 2022 07:44 AM
It doesn't works for the key request response time, because that metric aggregates the values for a "time slot" which is customisable in the data explorer but not in the SLO creation.
This time slot is set on automatic and can go from 1 minute (for small timeframes) to days in the larger timeframe.
By just counting the number of occurrences of the response time below a threshold you will get, for each time slot, 1 or 0.
OP got it right using fold(sum), because you need to find how many times you were below (good values) in the timeframe.
Options
- Mark as New
- Subscribe to RSS Feed
- Permalink
29 Sep 2022 08:05 AM
I forgot to add that I don't know if there is a way to tell the SLO to don't use aggregated data for the response time but if there is I wasn't able to found it.
Options
- Mark as New
- Subscribe to RSS Feed
- Permalink
29 Sep 2022 10:32 AM
This the main problem for me - because I don't want to have sum of avg count, but sum of count and filter it...
look like partition is also not helpful since we are using auto or avg for aggregation before filter.
Options
- Mark as New
- Subscribe to RSS Feed
- Permalink
29 Sep 2022 11:46 AM
Ok, now I understood what are you saying. I missed the part, in the original question, where he says "without using a custom service metric".
To my best knowledge it doesn't seems possible, we can get a SLO out of the standard metric but it is limited to the aggregation of all the requests in the auto resolution for that timeframe but not a fine grain number based on all the requests.
Reply
Featured Posts
