- Dynatrace Community
- Ask
- Open Q&A
- How to get exact line of code causing slowness
- Subscribe to RSS Feed
- Mark Topic as New
- Mark Topic as Read
- Pin this Topic for Current User
- Printer Friendly Page
- Mark as New
- Subscribe to RSS Feed
- Permalink
22 Jun 2022
06:32 PM
- last edited on
23 Jun 2022
09:24 AM
by
![]() MaciejNeumann
MaciejNeumann
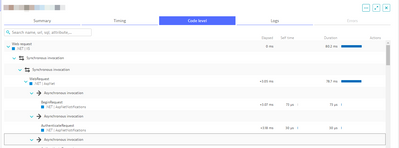
I know we get Code Level information as seen below in Purepath.
But this doesn't give the information about which exact line of code is causing the issue (slowness/failure).
Is there anyway Dynatrace could point the exact line of code from source code which is causing the issue?
Solved! Go to Solution.
- Labels:
-
distributed traces classic
- Mark as New
- Subscribe to RSS Feed
- Permalink
22 Jun 2022 08:24 PM
It depends on the collected stacktraces. You can use method hotpost functionality to get insight into what class / method is the "hotspot" - which one is most present in the stack frames. You can't drill down to line of code, since that's not the level Dynatrace is able to get.
Featured Posts

