- Dynatrace Community
- Learn
- Dynatrace tips
- Building a Robust Micrometer Integration
- Subscribe to RSS Feed
- Mark Topic as New
- Mark Topic as Read
- Pin this Topic for Current User
- Printer Friendly Page
Building a Robust Micrometer Integration
- Mark as New
- Subscribe to RSS Feed
- Permalink
13 Aug 2023
05:19 AM
- last edited on
08 Sep 2023
07:41 AM
by
![]() MaciejNeumann
MaciejNeumann
Hi,
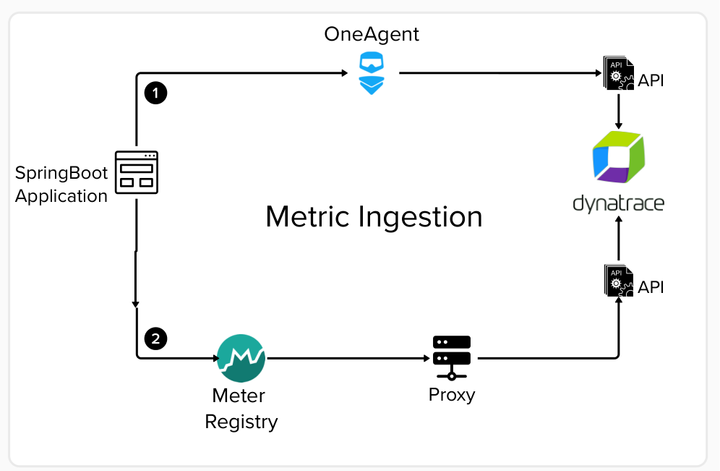
As Dynatrace developers its important to understand how metrics are sent to Dynatrace. Of course utilizing Dynatrace's OneAgent built-in detection is the first step to reaching observability. We also have access to intelligent extensions like Micrometer for building our own defined custom metrics through the Meter interface.
If you are familiar with the separate APIs, there are actually multiple methods of metric ingestions between version 1 and version 2 of the API. Correct me if I'm wrong but I believe version 2 came out when the OneAgent was implemented?
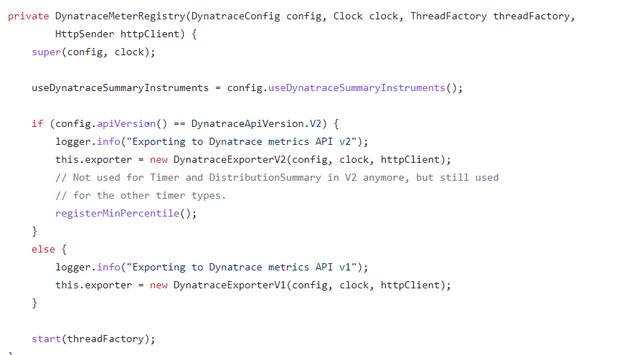
I recommend checking out the Dynatrace Meter Registry source code. It provides a lot of interesting insight on how Micrometer sends metrics to the API. For example there are two exporters that correlate to the two API versions.
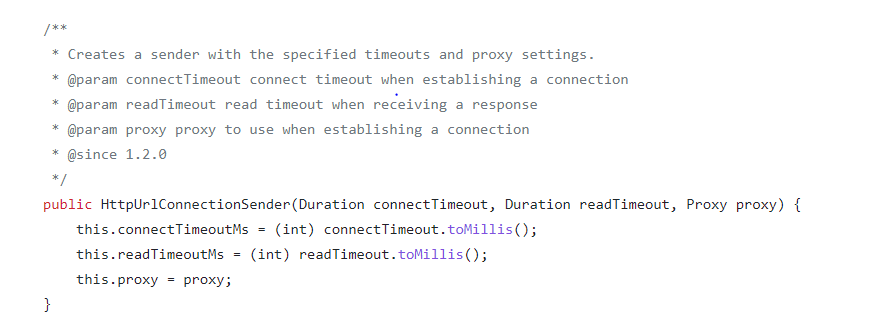
Taking a look at the Dynatrace Meter Registry Builder object you can see the HttpUrlConnectionSender() method. This is used to configure your organization's proxy server on the registry. This method uses a unique Micrometer interface called HttpSender which enables build REST communication for Micrometer metrics.
Let's take a look...
Here you can see that we a Proxy parameter.
So you'll want to create a Bean method that builds a proxy-based Meter Registry. Furthermore, you'll want to obtain those proxy parameters via property files using the "@Value" parameter annotation.
@Bean
public DynatraceMeterRegistry myfunction(DynatraceConfig config, @Value("{com.foo.barr.dynatrace.proxy}")){
your logic...
return registry
}
- Labels:
-
integrations
-
tips and tricks
- Mark as New
- Subscribe to RSS Feed
- Permalink
07 Sep 2023 01:39 PM
Thanks for sharing this @Nick-Montana
Featured Posts


